

Research Article | DOI: https://doi.org/10.31579/2835-8295/073
Association between gross savings and global innovation index from 2011 to 2020 in 125 countries
- Mario Roberto Alvarado Martínez *
- Karen Eduvina Castillo García 2
- Bessy Gabriela Pineda Andrade 3
- Jennifer Gabriela Varela Oliva 4
- Roger Eduardo Centeno Lago 5
- Edwin Roldan Medina Lopez 6
Researcher, UNAH, Honduras.
*Corresponding Author: Mario Roberto Alvarado Martínez, Universidad Nacional Autonoma de Honduras (UNAH), Honduras.
Citation: Alvarado Martínez MR, Castillo García KE, Pineda Andrade BG, Varela Oliva JG, Centeno Lagos RE, et al, (2024), Association between gross savings and global innovation index from 2011 to 2020 in 125 countries, International Journal of Clinical Reports and Studies, 3(4); DOI:10.31579/2835-8295/073
Copyright: © 2024, Mario Roberto Alvarado Martínez. This is an open-access artic le distributed under the terms of the Creative Commons Attribution License, which permits unrestricted use, distribution, and reproduction in any medium, provided the original author and source are credited.
Received: 04 July 2024 | Accepted: 26 July 2024 | Published: 12 August 2024
Keywords: (jel): e21 savings; g21 depository institutions; o36 open innovation; o16 savings and capital investment; o31 innovation and invention: processes and incentives
Abstract
The objective of the research was to related to the gross savings in millions of dollars $ USD variable (X) and the global variable innovation index (Y) in 125 countries from 2011 to 2020, the research design is empirical, due to its in-depth it is descriptive and correlational; time is longitudinal and the hypothesis was that savings has a strong correlation in relation to innovation and creativity. The results show the following: a) Gross savings in millions of dollars $ USD from 1970 to 2020 has negative asymmetry in 217 countries, figure 2. b) The Global Innovation Index has positive asymmetry from 2011 to 2023 in 125 countries, c) An alpha level α was used: 0.05, the two-tailed P(T<=t) test: 0.002107, from 2011 to 2020, so the null hypothesis that there is no relationship is rejected. The correlation coefficient shows that there is a strong relationship of more than +0.50 in 70 countries. The conclusion is that banking and financial systems must promote attractive savings models that are in ranges of 20% to 40% of GDP, free of all risk and thereby encourage creativity in society to generate wealth.
Introduction
We address the topic of creativity and innovation because it is currently an important part of business and economic analysis. Also, we analyze savings because we seek to find if there is any relationship with the inventive level of society.
Johnson Cornell University,INSEAD,WIPO (2014) The fundamental driver behind any innovation process is the human factor associated with it. We observe that some nations take the lead in innovation capability over others. A major factor for this disparity of innovation prowess is the quality of human capital linked to the innovation activities carried out in these nations. Other factors, such as technology and capital, also influence the innovation process; these directly correlate with the human factor. Hence nurturing human capital at all levels and in all sections of society can be crucial for developing the foundation for innovation.
Gross savings according to the World Bank is calculated as gross national income minus total consumption, plus net transfers. The OECD (2018) defines innovation as: a new or improved product or process (or a combination thereof) that differs significantly from the unit's previous products or processes and that has been made available to potential users (product) or put to use by the unit (process).
This research seeks to understand how savings affects creativity. Honduras is a country on the path to development, and managers at all hierarchical levels: horizontal and vertical need to understand where in the world there is a strong relationship between saving and creativity, and therefore work intensely on the adapted model that allows them to achieve their objectives.
The hypothesis proposed is that savings have a strong correlation with innovation and creativity, so the general objective is to establish the relationship between gross savings and the global innovation index, and the specific objective is to graph the shape of the variables with descriptive statistics.
Theoretical framework
(Azimova & Mollaahmetoğlu, 2017)The paper finds that the level of financial innovation and financial access are important parameters affecting both gross savings and gross domestic savings. The empirical results show that higher financial innovation lead tohigher savings, therefore confirming the “liberalization of financial market” hypothesis.
(Chavaglia Neto, Filipe, & Bento Caleiro, 2019)Considering the potential of behavioral economics as an analytic tool, it is possible to consider a general improvement of the analytical basis for implementing a survey in order to understand people's behavior in the economy.
(Attanasi, Chessa, Gil Gallen, & Llerena, 2021) A possible development of the experimental economic research is to analyze the interactions on creativity of a group over time, for example by modeling them via a dynamic network analysis.
(Fedyk & Xu, 2021) For instance, we are sceptical of associationism and connectionism, but we find reading about creativity enjoyable. A connectionist theory of creativity could be very creative by the lights of our theory, because it would be (scientifically) improbable and valuable (because theories of creativity are entertaining). We look forward to seeing what other (creative or not) theories of creativity can be germinated in the rich soil of contemporary cognitive science.
(Alqararah, 2023) Accordingly, further editions of the GII should seek to introduce alternative methodologies to the existing data, in order to increase the robustness and reliability of the rankings provided by the GII. This would allow for emphasizing different dimensions of the innovation system, highlighting those areas in which each country may show relative strengths, and weaknesses. We contend that these alternative methodologies would provide additional information to policymakers, so that effective policies can be adopted on each innovation system.
(Lee & Lee, 2023) Social spaces were frequently found to be influential on creativity, and it was noted that many studies treated creativity as an overall innovative culture of organizations, encompassing individual abilities and actions.
Materials and methods:
The research is empirical in nature, due to its depth it is correlational, its inference is hypothetical. The variables databases are quantitative, and the temporality is longitudinal or diachronic. The general objective was to establish the relationship between gross savings and the global innovation index, and the specific objective was to graph the shape of the variables with descriptive statistics. The hypothesis was that savings have a strong correlation with innovation and creativity. The population of the databases is 217 countries (includes islands and administrative zones), A representative sample for this population by the "Sturges rule" K=1+3.3(log n) would be: 8 countries (Sturges, 1926). In the normal distribution of the Gross Savings of 217 countries (includes islands and administrative zones), for the normal distribution of the Global Innovation Index a sample of 125 countries was taken. 125 countries were included in the correlation analysis.
1. In the variable (X) Gross Savings at current prices in dollars USD$ from 1970 to 2020 published by the World Bank obtained in: https://datos.bancomundial.org/indicator/NY.GNS.ICTR.CD
2. For the variable (Y) Global Innovation Index from 2011 to 2023 by country, the database prepared by available at: https://www.wipo.int/global_innovation_index/es/
3. The research model used two variables, figure 1:
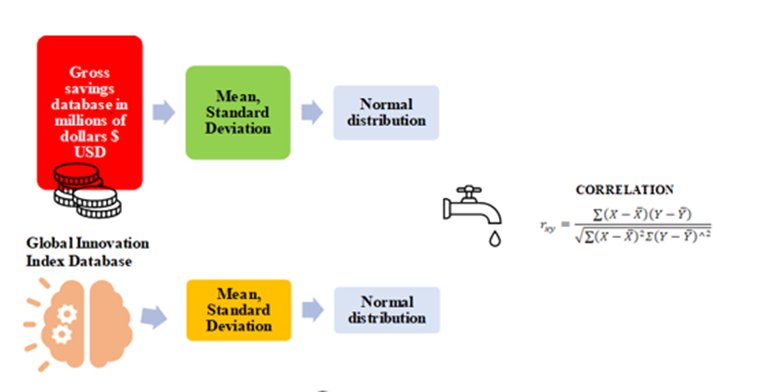
Source 1: Source: Authors 2024’ elaboration based on World Bank and WIPO database
Figure 1: Gross Savings Research Model and Global Innovation Index
Gross Savings in millions of dollars $ USD at current prices (X) and Global Innovation Index (Y).
Results and Discussion:
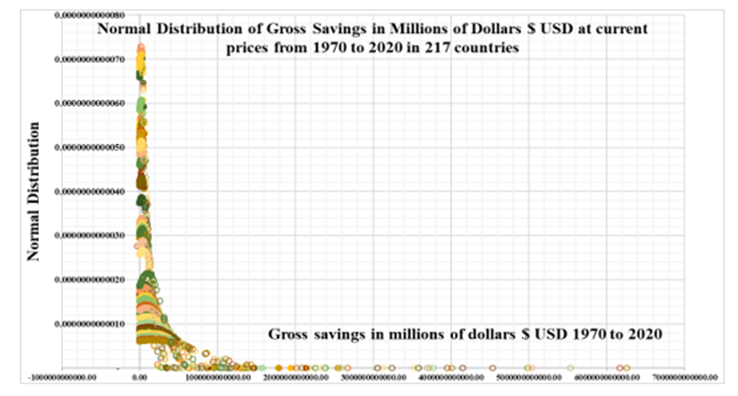
Source 2: Alvarado et als 2024, World Bank Database
Figure 2: Normal Distribution of Savings from 1970 to 2020 with positive asymmetry
Фμ,σ^2 (x)= ∫_(-∞)^x▒φ μ,σ^2 (u)du=1/(σ√(2 π )) ∫_(-∞)^x▒〖 e〗⎺.^(((u-μ)^2)/(2σ^2)) du,x∈R shows us that savings have positive asymmetry from 1970 to 2020 in 217 countries.
2. The normal distribution of the Global Innovation Index figure 3,
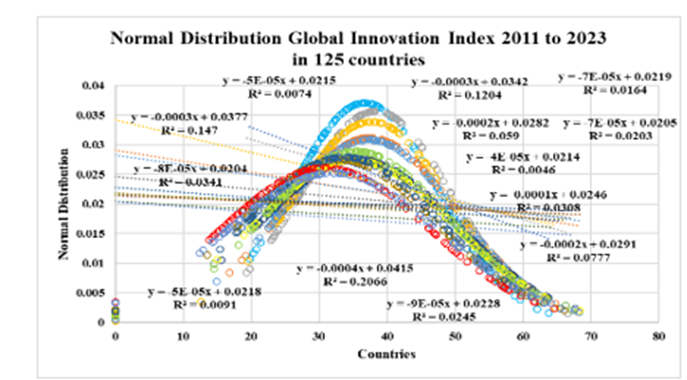
Source 3: Authors 2024’ elaboration using WIPO Database[1]
Figure 1: Normal Distribution of the GII Figure 3 : global Innovation Index from 2011 to 2023
Фμ,σ^2 (x)= ∫_(-∞)^x▒φ μ,σ^2 (u)du=1/(σ√(2 π )) ∫_(-∞)^x▒〖 e〗⎺.^(((u-μ)^2)/(2σ^2)) du,x∈R [2] shows us that Innovation in 125 countries has positive asymmetry from 2011 to 2023.
- The correlation coefficient figure 4:
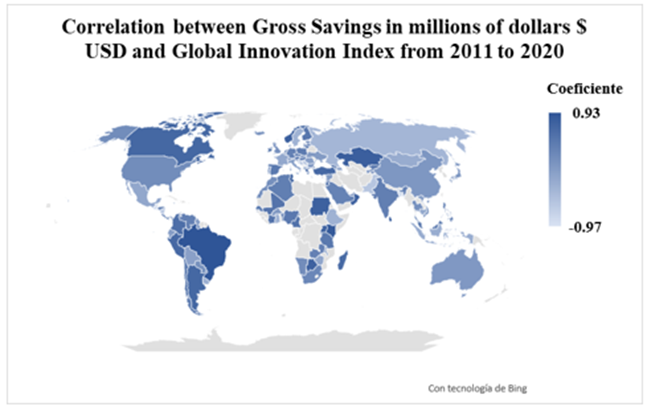
Source 4: Prepared with Bing 2024, BM and WIPO database
Figure 4: Correlation map by country between gross savings in millions of dollars $ USD and Global Innovation Index from 2011 to 2020
r_xy=(∑(X-X ̅ )(Y-Y ̅ ))/√(∑(X-X ̅ )^2 Σ(Y-Y ̅ ) .^2 ) between the gross savings in millions of dollars $ USD and the Global Innovation Index from 2011 to 2023 is shown in the following map of 125 countries, among the countries with the best coefficient we can mention: Brazil, Republic of Korea, Kuwait, Kenya, Sri Lanka, Kazakhstan, Norway, Sudan, Oman, Georgia, enlarged graphic in:
https://photos.google.com/photo/AF1QipOJ_j-q4kXJrBLJqtXn5xQpPnMHjgZvrNMjNGHB
- To understand how the relationship between gross savings in millions of dollars and the Global Innovation Index evolves table 1,
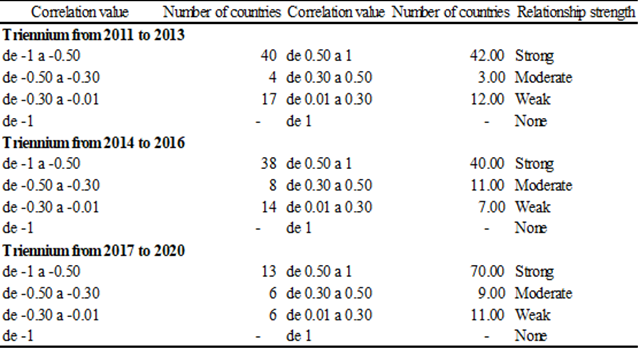
Source 5: Authors 2024’ elaboration using WB and WIPO database
Table 1 : correlation in trienniums 2011-2013; 2014-2016 And 2017-2020 In 125 Countries
The correlation was calculated in trienniums 2011-12013; 2014-2016 and 2017 to 2020, the results in table 1 show us that the countries have improved the relationship between savings and innovation in the four-year period from 2017 to 2020:
5. When reviewing the highest average in three years of the correlation coefficient we see that it is incremental in the following countries: Jordan, Zambia, Uganda, Norway, Canada, Benin, Madagascar, Peru, Ecuador, Georgia, however in a descriptive way the savings as a percentage % of GDP of innovative countries is between 20% and 40% of GDP, the data can be consulted at:
Discussion
This research agrees with (Azimova & Mollaahmetoğlu,2017) on that the level of financial innovation and financial access are important parameters that affect both gross savings and gross domestic savings. Savings are further perceived to be related to economic behavior, along the same lines as stated by (Chavaglia Neto, Filipe, & Bento Caleiro, 2019).
Here we perceive the savings in economic behavior very close to that set forth by (Chavaglia Neto, Filipe, & Bento Caleiro, 2019). Where the effort made to correlate variables contrasts with (Attanasi, Chessa, Gil Gallen, & Llerena, 2021) in terms of analyzing interactions on a group's creativity over time. However, the results are contrary to those presented by (Fedyk and Xu, 2021) because they explain that they are skeptical about associationism and connectionism.
The correlation of variables is an alternative methodological introduction to those suggested by (Alqararah, 2023) to show relative strengths and weaknesses. And as a final point we associate savings to culture, and culture as part of the social spaces that influence creativity very accurate with the conclusions of (Lee & Lee, 2023).
Conclusions:
1. Gross savings have positive asymmetry in the period from 1970 to 2020 in 217 countries figure 2 and the Global Innovation Index is symmetrical, figure 3, clearly balanced in 125 countries from 2011 to 2023.
2. When drawing up the correlation between gross savings in millions of dollars $ USD at current prices and global innovation index, Figure 4 shows that the following countries have a strong correlation coefficient: Brazil, Republic of Korea, Kuwait, Kenya, Sri Lanka, Kazakhstan, Norway, Sudan, Oman, Georgia.
3. When analyzing data in longitudinal periods of three years, to evaluate the evolution of the relationship table 1, we verified that in the period 2017 to 2020, the number of countries with a strong relationship increased, these results show us shows that savings must be maintained within a range of 20% and 40% of GDP to have an effect on innovation.
4. The results answer the research question as to whether there is any relationship between both variables, the answer is affirmative. An alpha level α was used: 0.05, the two-tailed P(T<=t) test: 0.002107, from 2011 to 2020, Therefore, the null hypothesis that there is no relationship is rejected. This opens the possibility for the banking and financial systems to promote creative models and protection of savings, to facilitate creativity and innovation in their countries and societies. See data in: https://photos.app.goo.gl/9UACv6iB47zgcitn9
Conflict of interest
The authors (Mario Roberto Alvarado Martínez; Karen Eduvina Castillo García, Bessy Gabriela Pineda Andrade, Jennifer Gabriela Varela Oliva, Roger Eduardo Centeno Lagos, Edwin Roldan Medina Lopez) affirms that there are no conflicts of interest to disclose
References
- Alqararah, K. (2023). Assessing the robustness of composite indicators: the case of the Global Innovation Index. Journal of Innovation and Entrepreneurship, 19.
View at Publisher | View at Google Scholar - Attanasi, G., Chessa, M., Gil Gallen, S., & Llerena, P. (2021). A survey on experimental elicitation of creativity in economics. Revue D´Economie Industrielle, 317.
View at Publisher | View at Google Scholar - Azimova, T., & Mollaahmetoğlu, E. (2017). Innovation in financial markets and its impact on savings. Journal of Bussiness, Esconomics and Finance, 6(2), 154.
View at Publisher | View at Google Scholar - Chavaglia Neto, J., Filipe, J., & Bento Caleiro, A. (2019). Creativity and innovation: A contribution of behavioral economics. International Journal of Innovation Studies, 3(1), 20.
View at Publisher | View at Google Scholar - Fedyk, M., & Xu, F. (2021). Creativity as potentially valuable improbable constructions. European Journal for Philosophy of Science, 27.
View at Publisher | View at Google Scholar - Johnson Cornell University, INSEAD, WIPO. (2014). The Global Innovation Index. Geneva, Switzerland; Delhi, India: Soumitra Dutta, Bruno Lanvin, and Sacha Wunsch-Vincent. Recuperado el 21 de 07 de 2024.
View at Publisher | View at Google Scholar - Lee, J., & Lee, S. (2023). Relationships between physical environments and creativity: A scoping review. Thinking Skills and Creativity, 48.
View at Publisher | View at Google Scholar - Sturges, H. (1926). La elección de un intervalo de clase. Revista de la Asociación Estadounidense de Estadística, 21(153), 65-66. doi:https://doi.org/10.1080/01621459.1926.10502161
View at Publisher | View at Google Scholar - undefined
View at Publisher | View at Google Scholar
