

Research Article | DOI: https://doi.org/10.31579/2835-8325/084
Remediation of low-density polyethylene (LDPE), and polyvinyl chloride (PVC) microplastics with porous sulfur polymers
- Delia Teresa Sponza *
Dokuz Eylül University, Engineering Faculty, Environmental Engineering Department, Buca İzmir Turkey
*Corresponding Author: Delia Teresa Sponza, Dokuz Eylül University, Engineering Faculty, Environmental Engineering Department, Buca İzmir Turkey.
Citation: Delia T. Sponza, (2024), Remediation of low-density polyethylene (LDPE), and polyvinyl chloride (PVC) microplastics with porous sulfur polymers, Clinical Research and Clinical Reports, 4(4); DOI: 10.31579/2835-8325/084
Copyright: © 2024, Delia Teresa Sponza. This is an open-access article distributed under the terms of the Creative Commons Attribution License, which permits unrestricted use, distribution, and reproduction in any medium, provided the original author and source are credited.
Received: 10 June 2024 | Accepted: 20 June 2024 | Published: 12 July 2024
Keywords: low-density polyethylene (ldpe); polyvinyl chloride (pvc); porous sulfur polymer nanocomposite; photodegradation; microplastic
Abstract
In this study, the phototransformation of low-density polyethylene (LDPE), and polyvinyl chloride (PVC) was promoted in porous sulfur polymer nanocomposite under sunlight. In order to investigate the potential photo catalytic effects of porous sulfur polymer the effects of some operational conditions on the photoremoval yields of during the transforLDPE and PVC were studied. 99% and 96% for LDPE and PVC yields was at a PB concentration of 3 mg/l, at LDPE and PVC concentrations of 400 mg/l a a nanocomposite size and surface area of 10 micron and 0,098 m2/m,respectively, at 40 Oc temperature a a pH of 5.00 at a sun ligth power of 50 W/m2. The FTIR analysis showed that the -SSH sulfanes groups porous sulfur polymers disappeared at 909 cm−1 at So / PB mass ratios of 20:40 to 30: 60 and to 60:120. TGA analysis showed the thermal stability of the porous sulfur polymer nanocomposites. XRD analysis showed that the persitance of the nanocomposite with the presence of pure salt at 2θ=31°, 46°, 56°, and 66° after treatment.
Introduction
Microplastics generated from the degradation of plastics in the environment due to sunlight, air, moisture, and heat [1,2]. They can contain som toxic compounds which can threaten the ecocystem. Flora and fauna can be exposed to the aforementioned pollutants and they can be ingested and eaten due to their minimized size liken nanometer and micrometer.
[3,4]. This toxicity of some microplastics can cause inhibitions to the aquatic and terrestrial Organisms. The presence of microplastics in wastewater was investigated by a lot of recent studies The main source providing the disturbances and emissions of these pollutants was the surface runoffs [5-7]. On the other hand, the concentrations of some personal care products containing fragments increased. Some microplatics cannot be treated in conventional treatment plants and some microplastics can be released to the rivers and and to the oceans [8-10]. The existing technologies used in the wastewater treatment plants (coagulation, filtration, and advanced oxidation processes) cannot removed effectively and large volumes of wastewaters containing microplastics was discharged to the receiving water bodies. In last decades a lot of microplastic removal processes was developed for microplastic removal like adsorption, magnetic extraction, membrane filtration, coagulation and photodegradation [11-13]. Among these processes, photodegradation is a promising process to degrade the microplastics under UV ligth. Under this ligth, the electrons in the the nanocomposites activated and generated electron-hole pairs resulting in reactive oxidizing species (ROS). These species can then break down the microplastics into harmless byproducts, such as carbon dioxide and water.
Polymeric materials such as low-density polyethylene (LDPE), high-density polyethylene (HDPE), polypropylene (PP), polyethylene terephthalate (PET), polystyrene (PS), and polyvinyl chloride (PVC) are common materials under study due to their widespread use, particularly in the packaging industry, which contributes to microplastic pollution in the World[14-17]. The biodegradability of microplastic-based materials like polyurethanes (PU), polylactic acid (PLA), nylon, polycarbonates, and were studied [18-20]. Microplastics are decomposed through photodegradation and possible biodegradation, [21-24]. The physicochemical properties of polymers depend on environmental conditions such as weather conditions, temperature, irradiation and pH values. Microplastics in aqueous bodies are a potential threat to aquatic species and they were considered an emerging contaminant. They are not degraded, and they can adhere to animals when they enter the food chain. On the other hand, they can adsorb some harmful pollutants.
Sulfur polymers have numerous applications like optoelectronic, superhydrophobic materials, and photochemical materials, biopolymers and proton-conducting electrolytes. The porous sulfur-containing polymers can be used to adsorpt the heavy metals. On the other hand, the photoactive properties of sulfur-containing polymers were reported. The porous sulfur-containing polymers was used for removing organic contaminants from pharmaceuticals, personal care products, and endocrine disruptors.
In this study low-density polyethylene (LDPE), and polyvinyl chloride (PVC) microplastics was choosen to remediate them with porous sulfur-containing polymer using 1,3-diisopropenylbenzene via photodegradation. The effects of some operational parameters like concentration of pollutants and nanocomposite, surface area of nanocomposite, temperature, pH and light intensity on the photodegradation yields of LDPE and PVC was studied.
Material and Methods
Production of porous sulfur-containing polymer nanocomposite
Elemental sulfur was heated under 190–210 °C in a magnetic stirring. Once completely molten then certain amount of 1,3-diisopropenylbenzene (PB) was added. So / PB mass ratio was varied from 20:40 to 30: 60 and to 60:120. The component was stirred, the still-liquid pre-polymer was transferred in a silicone cap. Te mixture was blended and it was maintained at 160 °C for 6 h.
Characterization of porous sulfur-containing polymer nanocomposite
To characterization of porous sulfur-containing polymer, nitrogen adsorption/desorption isotherms were acquired at 79 K using a surface area analyzer (NOVA). Scanning Electron Microscopy (SEM) imaging and Energy-Dispersive X-ray Spectroscopy (EDS) were performed using an FEI Inspect F system with an operational acceleration voltage of 10–20 kV. Fourier transformed infrared (FTIR) spectra were recorded using a Bruker Tensor 27 instrument over the wavenumber range of 500 to 4000 cm−1. Powder X-ray difraction patterns were performed by Panalytical X’Pert PRO MPD equipped PIXcel detector. Cu Kα radiation was utilized, and data were collected over a range of 5–70° using loose powder samples on thin Mylar flm within aluminium well plates. Termogravimetric analysis (TGA) (was conducted under an inert atmosphere on a TA Instruments TGA 5500. Heating was carried out at a heating rate of 10 ºC min−1, from room temperature to 600 °C.
Analytical Measurements
LDPE and PVC were analyzed by a gas chromatograph with a flame ionization detector using a TRACE GC gas chromatograph. It was provided with a 30 m × 0.32 mm Rtx-1 column.
Photocatalytic studies
Photocatalytic experiments were carried out in a laboratory scale reactor made of quartz with a volüme of 3 l. The photorector was a vertical tubular reactor, and the treated solution was circulated by a peristaltic pump operating with a speed of 20 l h−1. The loop contained also a sampling port and was fed with air at a rate of (2,0 cm3 s−1).
Results and Discussion
FTIR analysis results
Te extent of PB mass ration (60 and 120) indicates the consumption of double bonds during the crosslinking process (Figure 1). The -SSH sulfanes groups also in porous sulfur polymers disappeared at 909 cm−1 band in the FTIR spectra at So / PB mass ratios of 20:40 to 30: 60 and to 60:120 (Figure 1). As a result, of polymerization the peaks associated with sulpfur monomer exhibited maximal peaks at 698 cm−1 band in the FTIR spectra (Figure 1). This showed the presence that C-S bond formation. The exhibited the peaks relevant to sulfur comonomer units which has an appearance at 690 cm−1 band in the FTIR spectra,illustrating the C-S bonds
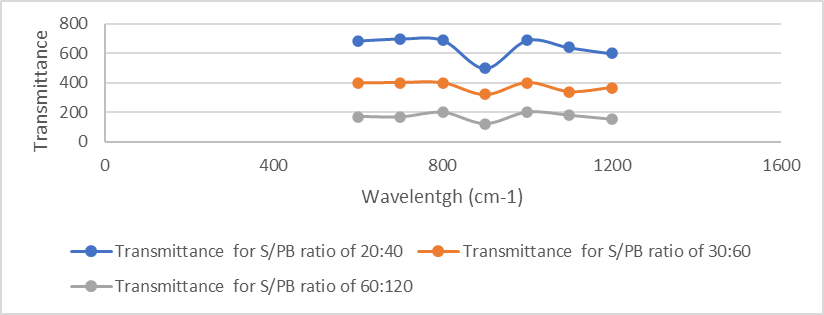
Figure 1: FTIR analysis results of PB nanocomposite at different S/ PB ratios
TGA analysis results
In order to detect the thermal stability of porous sulfur polymers (PB), TGA analysis were performed. Figure 2 illustrates TGA thermograms of porous sulfur polymers at different percentages of varying weight percentages of sulfur and PB. Te graph depicts that the degradation of pure sulfur commences at approximately 190 °C, with complete weight loss (100%) observed around 283 °C. However, the PB exhibited a higher decomposition temperature than pure sulfur. Additionally, the PB had a residue at 600 °C, and this residual content increased with a rise in pollutant content within the composition.
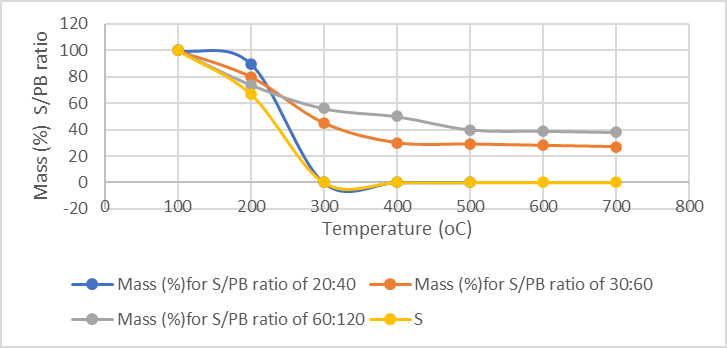
Figure 2: TGA analysis results
XRD analysis results
XRD patterns for pure sulfur and porous sulfur polymer nanocomposite after water treatment are presented in Figure 3. In the case of pure sulpfur, characteristic difraction peaks were discernible at 2θ=23°, 27°, 28°, 53°, and 56°. However, these peaks were absent following the copolymerization reaction in polymers containing over 60% PB content. This absence suggests
a transformation from crystalline monoclinic sulfur to a highly cross-linked amorphous copolymer structure. Te difraction peaks originating from pure salt (at 2θ=31°, 46°, 56°, and 66°) remained observable in PB afer water treatment. This persistence indicates the presence of residual table salt even afer the water washing treatment.
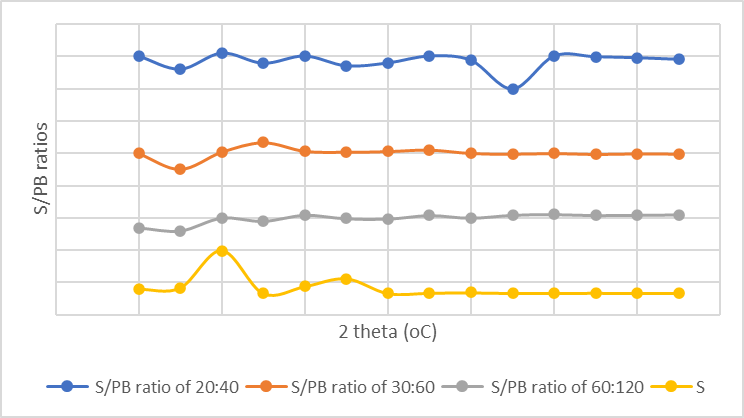
Figure 3: XRD analysis results
SEM analysis results
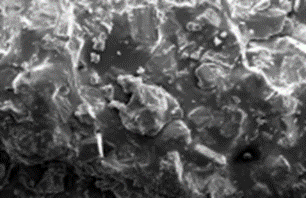
SEM images of raw PB with a So to PB mass ratio of 20:40 before treatment indicated the pesence of a non-porous surface (Figure 4a). The SEM image indicates homogenous disturbances of salt and sulfur in the PS nanocomposite. Afer treatment, these salts were dissolved and a porous structure was generated (Figure 4b). The non homogenous structure of pore can be increased with salt. Figure 4c showed that the pores sizes increased. This increases the surface contour of the porurs media for increase the adsorption process at the beginning of photodegradation. [29-30].
 | 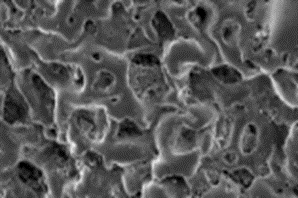 | 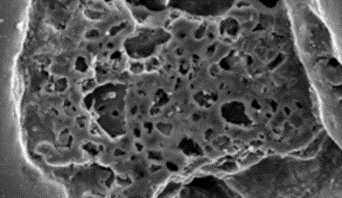 |
a (magnification : 5µm) | B (magnification : 5µm) | C (magnification : 500 µm) |
Figure 4: SEM image of porous sulfur polymers at a So / PB mass ratio of 20:40 in raw PB (a), treated PB (b), treated PB(c)
Effects of nanocomposite concentration
The PB nanocomposite concentration was increased from 1 mg/l up to 5 mg/l with a S/PB ratio of 20:40 to detect the the optimal nnocomposite dose for maximal LDPE and PVC photodegradation yields. The photocatalytic activity of LDPE and PVC enhanced when the PB concentration was increased from 1 mg/l to 2 and 3 mg/l (Table 1). The yields reached from 70% - 72% to 84% and 88% and to 99% and 96% for LDPE and PVC at a PB concentration of 3 mg/l. Further increase of PB nanocomposite concentration showed sligthly lowest photocatalytic activity. The LDPE and PVC yields decreased to 84% and 81% at 5 mg/l PB nanocomposite concentration. The photodegradation yields of LDPE and PVC pollutants are influenced by the active site and the photoabsorption of the catalyst used. Adequate loading of PB nanocomposite increases the generation rate of electron/hole pairs for enhancing the photodegradation of LDPE and PVC microplastics. High dose of the PB lowered the light penetration and reduces the photodegradation percentages of polutants. At high PB nanocomposite concentration the surface area decreased while the size of the nanocomposite increased [31-33].
PB nanocomposite concentration (mg/l) | LDPE Photodegradation yields (%) | PVC Photodegradation yields(%) |
1 | 72 | 70 |
2 | 88 | 84 |
3 | 99 | 96 |
4 | 94 | 90 |
5 | 84 | 81 |
Table 1: Effect of nanocomposite concentration on the photodegradation yields
Effect of LDPE and PVC concentrations
The effect of initial pollutant concentration on the photocatalytic degradation is illustrated in Table 2. It was observed that the phodegradation efficiency as a function increasing pollutant concentration. At 50, 100, 200 and 400 mg/l LDPE and PVC concentrations the yields recorded between 98-99% and 95-96%, respectively for LDPE and PVC. When the pollutant concentrations were incresed to 500 and 700 mg/ irradiation was not adequate to complete the degradation of the pollutants. The yields of pollutants decreased to 85-89% and to 79-75% for LDPE and PVC [34,35].
LPDE and PVC concentrations ( mg/l) | LDPE Photodegradation yields(%) | PVC Photodegradation yields(%) |
50 | 99 | 97 |
100 | 98 | 98 |
200 | 99 | 97 |
400 | 99 | 98 |
500 | 89 | 79 |
700 | 85 | 75 |
Table 2: Effect of pollutant concentration on the photodegradation yields
Effect of surface area
The PB nanocomposite surface area significantly affects the pollutant removal efficiencies during the photodegradation during photocatalysis. The activity of PB depends on on the holes and electron during activation of PB nanocomposite. Small particle sized PB nanocomposite (10 nm) sizes translate to reduced distance tranferring the electrons and holes during photocatalysis ending with high LDPE and PVC photodegradation yields (99% and 96%) (Table 3). PB Nanocomposites with a size 40 nm the PB exhibited high photodegradation yields (98% and 95%).
In this study negligible weight losses were observed for PB nanocomposite resulting in, surface area effect of photodegradation yields was not significant.
PB anocomposite size (micron) and surface area ( m2/m | LDPE Photodegradation yields(%) | PVC Photodegradation yields (%) |
10, 0,098 | 99 | 96 |
40, 0,178 | 90 | 82 |
100, 0,234 | 88 | 79 |
Table 3: Effect of nanocomposite size and surface on the photodegradation yield
Effect of temperature
The temperature was increased from 20 oC up to 25, 30 and 40 Oc. At 20 oc the PLDE and PVC yields was accounted as 94% and 97%, respectively. As the temperature was increased to 40 Oc the LDPE and PVC yields reached to a maximum (99% and 97%) (Table 4). Generally, at high temperatures like 80°C, there is ecombination of charge carriers, ending with inhibition of photodegradation. As the temperature was increased to 40°C the photocatalytic activity increased since the kinetic energy for the reactive species elevated [36].
Temperature (Oc) | LDPE Photodegradation yields (%) | PVC Photodegradation yields (%) |
20 | 72 | 70 |
25 | 88 | 83 |
30 | 90 | 86 |
40 | 99 | 97 |
80 | 60 | 52 |
Table 4: Effect of temperature on the photodegradation yields
Effect of pH
The formation of reactive oxidizing species by photocatalyst depends to pH. The pH influences the electrical double-layer charge at the solid electrolyte interface, affecting the formation of the electron–hole pairs on the surface of the photocatalyst [32-34]. Variation in pH modifies the potentials of catalytic processes. The surface of PB nanocomposite is positively charged at pH= 5 and negatively charged in apH of 8 (Table 5). LDPE and PVC exhibited crystalline structure and exhibited high photodegradation yields at pH=5.
PB nanocomposite concentration ( mg/l) | LDPE Photodegradation yields(%) | PVC Photodegradation yields(%) |
4 | 89 | 85 |
5 | 99 | 96 |
6 | 93 | 90 |
7 | 67 | 60 |
8 | 45 | 40 |
Table 5: Effect of pH on the photodegradation yields
Effect of sun ligth
The wavelength and intensity of sunligth affect significantly the the photodegradation of LDPE and PVC. The sun light is stronger than visible light because its waves are shorter than those of visible light. Therefore, it has higher efficiency in the photo degradation of microplastics. The number of photons available for activating the catalyst surface was relevant with sun intensity. The lower the intensity, the lower the activation energy; as a result,
low photodegradation efficiency is observed. With an increase in intensity, more active sites are activated increasing the interactions between the catalyst and the adsorbed substrate on its surface, hence higher degradation rates are attained. In this study it was found that the photodegradation yields of LDPE and PVC were maximum at a sun ligth intensity of 50 W/ m2 compared to 20 W/m2 (Table 6)
Sun Ligth (W/m2) | LDPE Photodegradation yields(%) | PVC Photodegradation yields(%) |
20 | 62 | 58 |
30 | 84 | 80 |
40 | 90 | 85 |
50 | 99 | 96 |
Table 6: Effect of sun power on the photodegradation yields
Conclusions
In this study two microplastics namely low-density polyethylene (LDPE), and polyvinyl chloride (PVC) was photodegraded by porous sulfur polymer nanocomposite under optimized conditions. High photodegradation yields as high as 99% and 97% was detected for LPDE and PVC, respectively. This nano composited can be suggested to the photo removal of other microplastics degraded with difficulty at short times.
References
- Gogoi A, Mazumder P, Tyagi VK, Chaminda GT, An AK, Kumar M. (2018). Occurrence and fate of emerging contaminants in water environment: A review. Groundw Sustain Dev, 6:169-180.
View at Publisher | View at Google Scholar - Liu X, Shi H, Xie B, Dionysiou DD, Zhao Y. (2019). Microplastics as both a sink and a source of bisphenol A in the marine environment. Environ Sci Technol, 53:10188-10196.
View at Publisher | View at Google Scholar - Wu P, Tang Y, Jin H, Song Y, Liu Y, Cai Z. (2020). Consequential fate of bisphenol-attached PVC microplastics in water and simulated intestinal fluids. Environ Sci Ecotechnology, 2: 100027.
View at Publisher | View at Google Scholar - Song X, Zhuang W, Cui H, Liu M, Gao T, Li A, et al. (2022). Interactions of microplastics with organic, inorganic and bio-pollutants and the ecotoxicological effects on terrestrial and aquatic organisms. Sci Total Environ, 838:156068.
View at Publisher | View at Google Scholar - Campanale C, Massarelli C, Savino I, Locaputo V, Uricchio VF. (2020). A detailed review study on potential effects of microplastics and additives of concern on human health. Int J Environ Res Public Health, 17: 1212.
View at Publisher | View at Google Scholar - Yaseen A, Assad I, Sofi MS, Hashmi MZ, Bhat SU. (2022). A global review of microplastics in wastewater treatment plants: Understanding their occurrence, fate and impact. Environ Res, 212:113258.
View at Publisher | View at Google Scholar - Gatidou G, Arvaniti OS, Stasinakis AS. (2019). Review on the occurrence and fate of microplastics in sewage treatment plants. J Hazard Mater, 367:504-512.
View at Publisher | View at Google Scholar - Habib RZ, Thiemann T, Al Kendi R. (2020). Microplastics and wastewater treatment plants—A review. J Water Resour Prot, 12:97637.
View at Publisher | View at Google Scholar - Wang C, O'Connor D, Wang L, Wu WM, Luo J, Hou D. (2022). Microplastics in urban runoff: Global occurrence and fate. Water Res, 225: 119129.
View at Publisher | View at Google Scholar - Han N, Zhao Q, Ao H, Hu H, Wu C. (2022). Horizontal transport of macro-and microplastics on soil surface by rainfall induced surface runoff as affected by vegetations. Sci Total Environ, 831:154989.
View at Publisher | View at Google Scholar - Lu Y, Li MC, Lee J, Liu C, Mei C. (2023). Microplastic remediation technologies in water and wastewater treatment processes: Current status and future perspectives. Sci Total Environ, 868: 161618.
View at Publisher | View at Google Scholar - Liu W, Zhang J, Liu H, Guo X, Zhang X, Yao X, et al. (2021). A review of the removal of microplastics in global wastewater treatment plants: Characteristics and mechanisms. Environ Int, 146: 106277.
View at Publisher | View at Google Scholar - Kwon HJ, Hidayaturrahman H, Peera SG, Lee TG. (2022). Elimination of microplastics at different stages in wastewater treatment plants. Water, 14: 2404.
View at Publisher | View at Google Scholar - Wang J, Sun C, Huang QX, Chi Y, Yan JH. (2021). Adsorption and thermal degradation of microplastics from aqueous solutions by Mg/Zn modified magnetic biochars. J Hazard Mater, 419
View at Publisher | View at Google Scholar - Liu F, Nord NB, Bester K, Vollertsen J. (2020). Microplastics removal from treated wastewater by a biofilter. Water, 12:1085.
View at Publisher | View at Google Scholar - Wang L, Kaeppler A, Fischer D, Simmchen J. (2019). Photocatalytic TiO2 micromotors for removal of microplastics and suspended matter. ACS Appl Mater Interfaces, 11: 32937-32944.
View at Publisher | View at Google Scholar - Uheida A, Mejía HG, Abdel-Rehim M, Hamd W, Dutta J. (2021). Visible light photocatalytic degradation of polypropylene microplastics in a continuous water flow system. J Hazard Mater, 406:124299.
View at Publisher | View at Google Scholar - Xu Q, Huang QS, Luo TY, Wu RL, Wei W, Ni BJ. (2021). Coagulation removal and photocatalytic degradation of microplastics in urban waters. Chem Eng J, 416: 129123.
View at Publisher | View at Google Scholar - Ebrahimbabaie P, Yousefi K, Pichtel J. (2022). Photocatalytic and biological technologies for elimination of microplastics in water: Current status. Sci Total Environ, 806: 150603.
View at Publisher | View at Google Scholar - Ouyang Z, Yang Y, Zhang C, Zhu S, Qin L, Wang W, et al. (2021). Recent advances in photocatalytic degradation of plastics and plastic-derived chemicals. J Mater Chem A, 9: 13402-13441.
View at Publisher | View at Google Scholar - Ge J, Zhang Z, Ouyang Z, Shang M, Liu P, Li H, et al. (2022). Photocatalytic degradation of (micro) plastics using TiO2-based and other catalysts: Properties, influencing factor, and mechanism. Environ Res, 209: 112729.
View at Publisher | View at Google Scholar - Devi MK, Karmegam N, Manikandan S, Subbaiya R, Song H, Kwon EE, et al. (2022). Removal of nanoplastics in water treatment processes: A review. Sci Total Environ, 845: 157168.
View at Publisher | View at Google Scholar - Mukherjee PS, Ray AK. (1999). Major challenges in the design of a large-scale photocatalytic reactor for water treatment. Chem Eng Technol, 22: 253-260.
View at Publisher | View at Google Scholar - Shen M, Song B, Zhou C, Hu T, Zeng G, Zhang Y. (2022). Advanced oxidation processes for the elimination of microplastics from aqueous systems: Assessment of efficiency, perspectives and limitations. Sci Total Environ, 842: 156723.
View at Publisher | View at Google Scholar - Rodriguez-Narvaez OM, Goonetilleke A, Perez L, Bandala ER. (2021). Engineered technologies for the separation and degradation of microplastics in water: A review. Chem Eng J, 414: 128692.
View at Publisher | View at Google Scholar - Xie A, Jin M, Zhu J, Zhou Q, Fu L, Wu W. (2023). Photocatalytic technologies for transformation and degradation of microplastics in the environment: Current achievements and future prospects. Catalysts, 13: 846.
View at Publisher | View at Google Scholar - Du H, Xie Y, Wang J. (2021). Microplastic degradation methods and corresponding degradation mechanism: Research status and future perspectives. J Hazard Mater, 418: 12637
View at Publisher | View at Google Scholar - Gewert B, Plassmann MM, MacLeod M. (2015). Pathways for degradation of plastic polymers floating in the marine environment. Environ Sci, 17: 1513-1521.
View at Publisher | View at Google Scholar - Tofa TS, Kunjali KL, Paul S, Dutta J. (2019). Visible light photocatalytic degradation of microplastic residues with zinc oxide nanorods. Environ Chem Lett, 17: 1341-1346.
View at Publisher | View at Google Scholar - Ariza-Tarazona MC, Villarreal-Chiu JF, Barbieri V, Siligardi C, Cedillo-González EI. (2019). New strategy for microplastic degradation: Green photocatalysis using a protein-based porous N-TiO2 semiconductor. Ceram Int, 45: 9618-9624.
View at Publisher | View at Google Scholar - Ariza-Tarazona MC, Villarreal-Chiu JF, Hernández-López JM, De la Rosa JR, Barbieri V, Siligardi C, et al. (2020). Microplastic pollution reduction by a carbon and nitrogen-doped TiO2: Effect of pH and temperature in the photocatalytic degradation process. J Hazard Mater, 395: 122632.
View at Publisher | View at Google Scholar - Allé PH, Garcia-Muñoz P, Adouby K, Keller N, Robert D. (2021). Efficient photocatalytic mineralization of polymethylmethacrylate and polystyrene nanoplastics by TiO2/β-SiC alveolar foams. Environ Chem Lett, 19: 1803-1808.
View at Publisher | View at Google Scholar - Yuwendi Y, Ibadurrohman M, Setiadi S, Slamet S. (2022). Photocatalytic degradation of polyethylene microplastics and disinfection of E. coli in water over Fe-and Ag-modified TiO2 nanotubes. Bull Chem React Eng Catal, 17: 263-277.
View at Publisher | View at Google Scholar - Ali SS, Qazi IA, Arshad M, Khan Z, Voice TC, Mehmood CT. (2016). Photocatalytic degradation of low density polyethylene (LDPE) films using titania nanotubes. Environ Nanotechnol Monit Manag, 5: 44-53.
View at Publisher | View at Google Scholar - Llorente-García BE, Hernández-López JM, Zaldívar-Cadena AA, Siligardi C, Cedillo-González EI. (2020). First insights into photocatalytic degradation of HDPE and LDPE microplastics by a mesoporous N–TiO2 coating: Effect of size and shape of microplastics. Coatings, 10: 658.
View at Publisher | View at Google Scholar - Tofa TS, Kunjali KL, Paul S, Dutta J. (2019). Visible light photocatalytic degradation of microplastic residues with zinc oxide nanorods. Environ Chem Lett, 17: 1341-1346.
View at Publisher | View at Google Scholar
