

Research Article | DOI: https://doi.org/10.31579/2835-8325/016
Heartbeat Cardiac Sounds Analysis
- Debbal Sidi Mohammed El Amine 1*
Genie Biomedical Laboratory (GBM), Genie Biomedical department, Faculty of Technology, University Abou Bakr Belkaid Tlemcen, Algeria.
*Corresponding Author: Debbal Sidi Mohammed El Amine, MscPT, Senior Clinical Physiotherapist, Centre for The Rehabilitation of The Paralysed
Citation: Debbal Sidi Mohammed El Amine, (2023), Heartbeat cardiac sounds analysis, Clinical research and clinical reports, 2(2); DOI: 10.31579/2835-8325/016
Copyright: ©, 2023, Debbal Sidi Mohammed El Amine. This is an open-access artic le distributed under the terms of the Creative Commons Attribution License, which permits unrestricted use, distribution, and reproduction in any medium, provided the original author and source are credited.
Received: 10 April 2023 | Accepted: 21 April 2023 | Published: 28 April 2023
Keywords: hidden markov models; HMM, envelope; segmentation; algorithm; cardiac frequency; murmur; pathology; first sound S1; second sound S2; heartbeat; cardiac
Abstract
Phonocardiography provides the clinician with a complementary tool to record the heart sounds heard during auscultation. This paper presents an algorithm for the detection of heart sounds (the first and second sounds, S1 and S2) and heart murmurs.
Secondly the heartbeat cardiac sounds represented by the phonocardiogram (PCG) signal once segmented is one of the useful approaches to explore cardiac activity and extract many features to help researchers develop techniques that can be used for the medical treatment of several heart diseases.
For people affected by a heart activity problem, it is a serious health problem that requires special care. In this paper, importance is given to heart murmurs and their severity to show their impact on heart rate. Heart murmurs are very widespread pathologies in the world and depending on their severity they could constitute.
This paper is concerned to the segmentation of heart sounds by using state of art Hidden Markov Models technology which used to extract a smooth envelogram which enable us to apply the tests necessary for temporal localization of heart sounds and heart murmurs.
Introduction
The heart is a principal organ which assures a blood circulation. Under normal conditions, the heart provides two major audible sounds (S1 and S2) for each cardiac cycle. Two other sounds (S3 and S4), with lower amplitude than S1 or S2, appear occasionally in the cardiac cycle by the effect of diseases or age [1]. The first heart sound S1, corresponding to the beginning of ventricular systole, is due to the closure of atrioventricular valves (Figure 1).
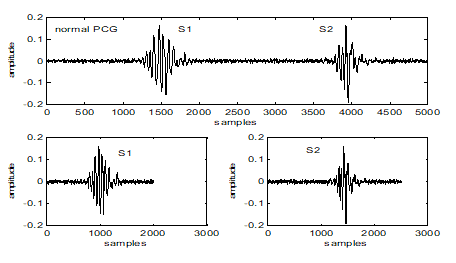
This First sound is composed of two internal components: the mitral component (M1) associated with the closure of the mitral valve, and the tricuspid component (T1) associated with the closing of the tricuspid valve [2]. The second heart sound, marking the end of ventricular systole and signifying the beginning of the diastole, is made up of two components: the aortic component (A2) corresponding of the closure of the aortic valve, and the pulmonary component (P2) corresponding of the closure of the pulmonary valve [2]. Valvular pathologies induce significant changes in the morphology of the Phonocardiogram Signal (PCG) [3]. On the other hand, systolic and diastolic murmurs of different shapes can be added to the PCG signal to build a track resulting from a given disease.The PCG signal is then a support of information to value by digital processing in order to better appreciate the pathologies to can be processed more easily. The energy of the PCG signal can prove therefore very important in the study of the cardiac cycle [4]. In the time domain, such representation allows us to appreciate the length of each heart sound, systolic and diastolic phases and the cardiac cycle.
Time-frequency analysis and classification of the PCG signals have been studied by several authors [5]. Before any analysis, the PCG signal needs to be segmented into components (sounds or murmurs), and then the components are analyzed separately. Some attempts to segment the PCG signal have been reported in the literature, but the majority of them depend on reference to the Electrocardiogram (ECG) signal [6-8], but a major disadvantage of this approach is that the timing between electrical and mechanical activities in a cardiac cycle will not be exactly constant for all patients because of a variety of pathological conditions [8].
The aim of this study is to develop an algorithm for heart Sound and heart murmur segmentation using the PCG signal as the only source. PCG signals have internal components of very close frequency bands. Fast Fourier Transform (FFT) provides valuable frequency information, but the timing information is lost during the transformation process [9]. Discrete Wavelet Transform (DWT), in using the band filter during PCG analysis, takes account only of the bandwidth of these filters.
In the context of analyzing other methods above, Zhihai Tu et al. [10]. presented a method of heart sounds (S1 and S2) extraction using Hilbert transform envelope.
Hhowever Hu Xiao-Juan et al. [11], had used this kind of envelope for the extraction of features of heart sounds. The Hilbert transform envelope also provides the possibility to analyze the internal components of heart sounds; it’s the only envelope able to detect the S1 and S2 split and extract their internal components [12].
Segmentation refers to the detection of major events in the cardiac cycle, such as the first and second sounds that are audible, pathological noises that can be added to the PCG signal during the systolic and diastolic phases. Several segmentation methods have been developed; some use the ECG signal and the carotid pulse as a reference [13, 14]. others are based only on the PCG signal. The majority of these methods are based on the information conveyed by the envelope detection of the PCG signal; where the latter crosses a predefined threshold.
These methods include envelope extraction using discrete decomposition and wavelet reconstruction [15]. or the use of magnitude of the analytical signal formed using the PCG signal and its “Transform Hilbert” [16, 17]. or by calculating the energy of Shannon [18]. However, these methods can lead to several problems such as the lack of low energy events such as the cardiac click which is not always clear by the signal envelope or detection of artifacts at high energy as cardiac activity, or the detection of additional peaks which come from split S2. A probabilistic method has been proposed in the literature for automatic segmentation of the phonocardiogram signal; it is the Hidden Markov model (HMM), which is based essentially on the envelope of the homomorphic filtering which makes it possible to generate a smooth envelope facilitating the extraction of the characteristics of the signal [19-21] showing the entrance to the HMM.
The parameters of the model are also estimated from the envelope used, the output of the HMM is the optimal sequence of states which maximizes the probability that the state at time t generates the observation which is the input of the model. Note that the states of the HMM are the areas of interest of the signal like heart sounds. In this paper we will study this method (HMM), trying to improve the characteristics extracted from the homomorphic envelope in order to improve the estimation of the model.
Based on this method, we will try in this study to develop an algorithm for separation of heart sounds and heart murmurs; which works by creating the analytic signal of the input by using the Hidden Markov Models technology which used to extract a smooth envelogram which enable us to apply the tests necessary for temporal localization of heart sounds and heart murmurs. In the scope of this segmentation difficulty the well-known non-stationary statistical properties of Hidden Markov Models concerned to temporal signal segmentation capabilities can be adequate to deal with this kind of segmentation problems.
After the segmentation of the phonocardiogram signal by using the Hidden Markov Model (HMM) we are going to study the variation in the heart rate under the effect of the importance of the murmurs added to PCG signal caracterizing a cardiac pathology.
To this end, this work aims to take the following steps:
1. Extract heart murmurs from a pathological PCG signal
2. Calculate their severity based on the energy ratio (ER)
3. To study the impact of murmur severity on heart rate variability.
Materials and Methods
Theory of the HHM model
A Hidden Markov Model (HMM) is a probabilistic state machine where the states of the machine are unobservable, but the outputs of the state machine are observable. A Hidden Markov model has the ability to provide signal equivalents with discrete or continuous responses.An example of a discrete HMM is a HMM that models the series of heart sound labels over time. An example of a continuous HMM is a HMM that models the Shannon energy feature over time.The cardiac signal can be modeled by putting it equivalent to an HMM having four outputs (levels). The first will correspond to the first heart sound S1, the second relates to the duration of the systole, the third will correspond to the second heart sound S2 and finally the last corresponds to the si diastolic period (Figure 1). The model in question in this four-level work is useful for representing the different signal events; Furthermore, it is very simplistic to accurately model the transitions between bcardiac noises and intermediate durations. One possibility is to use a second HMM model within each of the signal states studied. The embedded HMM models the signal as it traverses a specific labeled region of the signal. Using this combined approach, we can model both the highlevel state sequence of our signal (S1-sil-S2-sil) and the continuous transitions of the signal. This type of model is similar to how a speech processing system has a highlevel probabilistic grammar to model the transition of words or phonemes, and an embedded HMM for each phoneme [22].All of the experiments utilized an eight state HMM for the S1 sounds, a six state HMM for the S2 sound, and a three state HMM for each silence period. The number of sequences was calculated by using the average duration of each heart sound and dividing it by the duration of the frame. For example, S1 noise has an average duration of 160 milliseconds and the frame step size is 20 milliseconds; therefore, it can be represented by eight states (160 ms / 20 ms=8). In addition, the experiments utilized a four state grammar that represented the state model given in Figure 2. The probabilities for this model were learned using a discrete HMM where the label files were used to train the model. The resultant HMM represents the symbol transitions of the phonocardiogram. This is to translate the discrete HMM model into a combination for use with the HTK toolset [23].
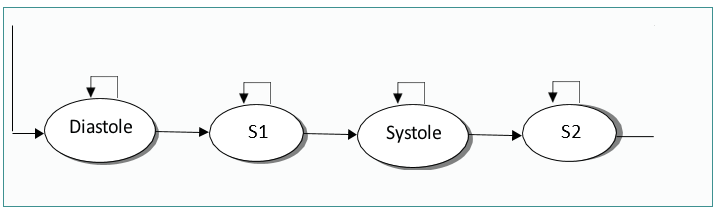
Figure 2. Heart sound Markov
Two different methods to measure system capabilities were used: frame error rate and pattern error rate. To obtain the frame error rate, we compare each frame of the labeled signal to the output signal
We calculate the error rate of the system by dividing the number of mismatched frames by the total number of frames in the system. To determine the model error rate, we calculate the center of the heart sound label and the center of the learned heart sound, and calculating the difference between these centers.
The system notes a successful labeling if the delta value between these centers is less than 50 milliseconds. Then, the error rate is the number of mismatched S1 or S2 labels divided by the total number of sound labels in the system.
We can measure frame error rate and pattern error rate simultaneously to verify and control system training and system validation. Since there were only clean records for eight patients, an eight-way cross-validation was done
Finally, the noisy files were validated against the model where the model was trained with only clean files.
2.2 Viterbi algorithm
The Viterbi algorithm (Figure 3) has been called "Andrew Viterbi", since 1967 as a decoding algorithm for convolutional codes over noisy digital communication links [23, 24]. It has, however, a history of multiple invention, with at least seven independent discoveries, including those by Viterbi, Needleman and Wunsch, and Wagner and Fischer [25, 26].
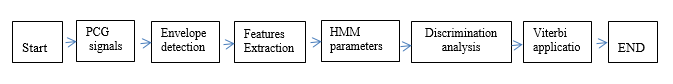
Figure 3. PCG signal segmentation algorithm by using the HHM model.
As an example, in statistical analysis, a dynamic programming algorithm can be employed in order to find the most possible context-free derivation (analysis) of a string, commonly called "Viterbi analysis" [27-29]. A second application is in target tracking, where the trail is computed that assigns maximum likelihood to a sequence of observations [30].
The idea is to use a re-estimation procedure which gradually refines the model according to the following steps:
• Choose an initial set Λ0 of parameters.
• Calculate Λ1 from Λ0, then Λ2 from Λ1, etc.
• Repeat this process until an end criterion.
For each learning step p, we have Λp and we look for a Λp + 1
which must verify:
P (O | Λp+1) ≥ P (O | Λp) (1)
It is now a question of determining the best path corresponding to the observation, that is to say of finding in the model Λ the best sequence of states Q, which maximizes the quantity P (Q, O | Λ).
To find Q= (q1, q2, QT) for a sequence of observations O= (O1, O2, OT), we define the intermediate variable δt (i) as the probability of the best path leading to the state if at time t, being guided by the first t observations
δt(i) = Max P (q1, q2, . . ., qt = si, O1, O2, . . ., Ot | Λ) (2)
By recurrence, we calculate
δt+1(j) = [Max δt(i) aij] bj(Ot+1) (3)
By keeping track, during calculation, of the state sequence which gives the best path. We use a variant of dynamic programming, the Viterbi algorithm to formalize this recurrence. It provides as output the value P* of the probability of the emission of the sequence by the best sequence of states (q * 1, • • •, q * T). The Argmax function allows you to store the index i, between 1 and n, with which you reach the maximum of the quantities (δt(i) aij)). The cost of operations is also in Θ (n2T).
2.3 Extraction of the murmur
The normalized average Shannon Energy envelogram is used for detected and to delimit the beginning and end of each heart sound with a threshold set from the maximum value of the envelope, the location of the heart sounds S1 and S2 will enable us thereafter to extract the heart murmurs using a threshold selection of them. The aim of this paper is time measurement of the sounds and the cardiac period and the interpretation of the impact of murmurs on the PCG signal
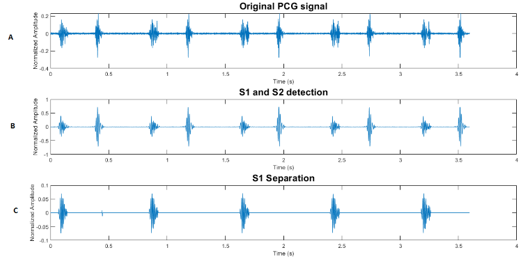
a) Extraction of the murmur and the sounds S1 and S
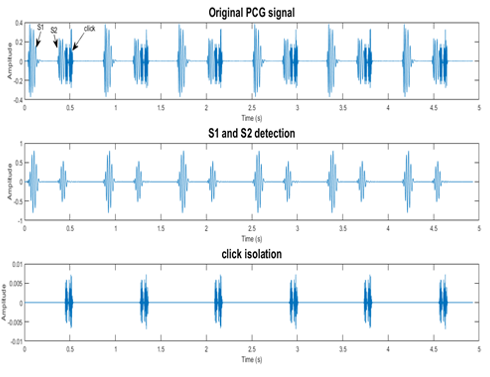
b) Separation of the sounds S1 and the sound S2
Figure 4: By use the segmentation technic proceed
Murmur extraction has been performed before by using the segmentation technique by calculating the envelope of the absolute value of the PCG signal in order to define the beginnings and endings of sounds S1 and S2 and heart murmurs. By eliminating the sounds S1 and S2 the murmur can be isolated on its own in order to carry out a specific treatment
2.4 Classification of severity of aortic stenosis by factors measured at the clinical level
The severity of cardiac pathologies has been calculated by several methods in the literature.
This classification is carried out in a normal cardiac output [25]. The table1 below shows the results of this method.
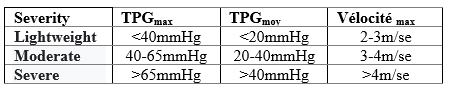
Table1: Classification of severities according to TPGmax ,TPGmoy and Velocitymax
Where
TPGmax : the maximum pressure gradientTPGmoy : average pressure gradientVélocitémax : maximum blood velocity
The main limitation of this technique is its dependence on transvalvular flow. In patients with severe ventricular dysfunction, and low cardiac output, it is then difficult to determine the severity of aortic stenosis from the pressure gradient alone, since it is similar to that of a subject with aortic stenosis mild or moderate.
The American Herat Association (AHA) and the American College of Cardiology (ACC) therefore recommend using effective valve area to quantify the severity of aortic stenosis [26]. An aortic valve becomes significantly stenotic if its effective area is less than approximately 1/4 of its normal value [26]. The effective area of a normal adult aortic valve is 3 − 4 cm2. According to the AHA/ACC criteria, aortic stenosis is considered:
- Lightweight if EOA > 1.5 cm2
- Moderate if i 1.0 cm2 < EOA>
- Severe if EOA ≤ 1.0 cm2
A valve area greater than 2 cm2 generally denotes a non-stenotic valve. In patients with low cardiac output, the valve may not open to its full capacity due to the presence of a low-pressure gradient. The value obtained from the EOA may tend to overestimate the severity of the aortic stenosis. It is therefore advisable to increase the patient's cardiac output, by injecting him with dobutamine, during the echocardiography examination.
2.5 Estimation of cardiac severity
Several works have been carried out in this context, the most striking being that of Dosik Kim and Morton E.Tavel [27]. In this study, they carried out a spectral analysis on the murmurs of a group of patients with cardiac pathology in order to assess its severity.
Design: An electronic stethoscope was used to generate spectral analysis of murmurs in patients with aortic stenosis. The durations of the spectra at different frequencies (i.e., 200, 250, and 300 Hz) were correlated to mean and peak pressure gradients derived from echographe Doppler. The latter found that the maximum pressure gradient measured by Doppler echocardiography ranged from 15.3 to 185 mm Hg with an average of 63 mm Hg. The duration of the spectra > 300 Hz correlated better with the maximum pressure gradient measured at using the Doppler echocardiogram
(Table 2) summarizes the results of this work:
| Degree of severity | TPGmax | Duration of murmur at 300 Hz |
| Lightweight | < 40> | < 0> |
| Moderate | 40-65 mmHg | 0.16-0.20 sec |
| Severe | > 65 mmHg | > 0.20 sec |
Table 2. Classification of severities according to TPGmax and murmur duration at 300Hz
Classification of severities according to TPGmax and murmur duration at 300Hz (Figure 5)
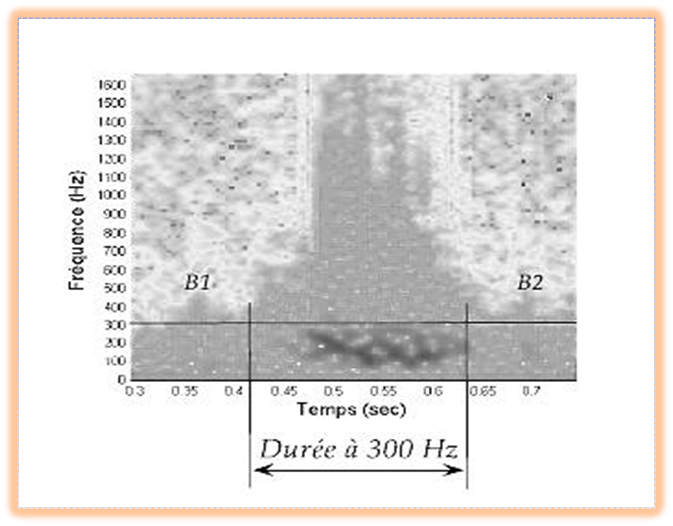
Figure 5. Time-frequency representation of a heart murmur. The horizontal line indicates the frequency at 300 Hz, the two vertical lines indicate the duration of the murmur measured at this frequency.Patients: Forty-one patients (age range: 45-94 years; mean age: 68 years)
F.Meziani et al [28] have proposed a method which is based on the time-frequency representation provided by the application of the continuous wavelet transform (TOC) on a pathological PCG signal. From this representation the frequency rate TΔF (%) is calculated, as being a quantity which reflects the total frequency dominance of the murmur on the heart sounds, the frequency range of the murmur presents an important indicator on the severity of the PCGs signals. The TΔF (%) is given by the following equation:
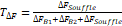
ΔFSouffle : the frequency range of the murmurΔFB1 : the frequency range of Sound S1ΔFB2 : the frequency range of the Sound S2
Unfortunately, this technique also has a limitation and shows the inability of the frequency range and the maximum frequency in the reliable monitoring of the evolution of the severity of some case (immersed breath).
Rijil Thomas et al [29] presented a method to quantify mitral regurgitation (MR) using the PCG signal. Mitral regurgitation is one of the most common cardiovascular diseases associated with a mitral valve defect. A multifractal analysis on the nature of heart sounds with breath tracking was performed.
Thus, they were able to classify patients' MR severities by correlating the complexity of heart sounds at four main auscultation sites, using a complexity analysis tool called singularity spectra. The simulation results show that the method can quantify the severity of MR using PCG.
2.4 Calculation of degree of severity
The results obtained in previous work on heart rate variability encouraged us to carry out an extensive study on murmurs and their impact on heart rate variability. By taking advantage of the particularity of the phonocardiogram signal which carries a lot of information on heart murmurs, something that is missing in the electrocardiogram signal.
In this aspect, it should be pointed out that murmurs are not always innocent and, in some cases, they are very dangerous and require urgent medical intervention, which is why this chapter gives primary importance to determining the severity of the murmurs and their impact on heart rate variability. An algorithm has been designed to extract features to better understand this phenomenon. This algorithm is based on two essential steps: the extraction of breaths and the calculation of gravity.
In this aspect, it should be pointed out that murmurs are not always innocent and, in some cases, they are very dangerous and require urgent medical intervention, which is why this chapter gives primary importance to determining the severity of the murmurs and their impact on heart rate variability. An algorithm has been designed to extract features to better understand this phenomenon. This algorithm is based on two essential steps: the extraction of murmurs and the calculation of gravity.
Once the murmurs have been extracted, they are classified according to their severity. There are many techniques for calculating severity. But unfortunately, these techniques have limitations either by their clinical dependence where the patient must be present at the clinical level to practice invasive techniques, or they do not give all the information about the murmurs because the chronology does not reflect the intensity of the murmur, that is why, in this study, we try to apply a method exploring the real severity of murmur
The severity calculation process relies on the calculation of energy as an important factor in defining the total presence of the murmur over the cardiac cycle by comparing it to the energy of the other main sounds S1 and S2. Based on previous studies [30-34] which have shown that the energy ratio is a fair index and a useful argument for severity classification, the ER energy ratio is given by the following equation:
Shortness of murmur is the energy of the murmur, ES1: the energy of the first heart sound S1, ES2: the energy of the heart sound S2. Blasts are graded by multiplying RE by 100 to get a percentage so that is between:
- 1%
- 30%
- 70%
Heart Sounds Cardiac Abnormality Database is from [35-36].
Results and Discussion
Analysis of the signalPCG by using the HHM model
Our HMM hidden Markov model applied to the different PCG signals is defined by 4 states: S1 and S2 sounds and the systolic and diastolic phases which can be silent or which can correspond to different heart murmurs. The envelope resulting from homomorphic filtering, we allow to extractthe best characteristics of the PCG signal for a better observation sequence. Given the following observation, we can determine the parameters of the Markov model Λ = {aij, μj, j, πi}. Therefore, we can establish the best state sequence by applying the Viterbi algorithm. The durations of heart soundsS1 and S2 as well as the systolic and diastolic phases were well estimated (Figure3).
Table 3 provides the segmentation results of the PCG signals byusing the HMM technic.
- The PCG signals with murmur contain S1 sound which has duration greater than that of B2 sound, as well as shorter systolicphase than diastolic.
- From Figure 6 at Figure 9 note that the application of HMM has given satisfactory results for the discrimination of the differentcomponents of PCG
- signals.
| Duration of thesound S1 (s) | Duration of the soundS2 (s) | Duration of the murmur (s) | Duration of the Systole (s) | Duration of the diastole (s) | ||
| Normal signal PCG | N | 0.08 | 0.06 | 0.18 | 0.34 | |
PCG signals of the systolic murmur | LS | 0.11 | 0.098 | 0.13 | 0.22 | 0.34 |
| MP | 0.08 | 0.06 | 0.22 | 0.22 | 0.26 | |
| AS1 | 0.06 | 0.04 | 0.27 | 0.3 | 0.28 | |
| AS2 | 0.062 | 0.049 | 0.18 | 0.24 | 0.38 | |
| PAS | 0.109 | 0.095 | 0.22 | 0.22 | 0.36 | |
| EM | 0.06 | 0.04 | 0.11 | 0.18 | 0.76 | |
| MR | 0.06 | 0.04 | 0.26 | 0.26 | 0.56 | |
| ASD | 0.08 | 0.1 | S-S 0.16 | 0.2 | 0.36 | |
| S-D 0.17 | ||||||
PCG signalsof the diastolic murmur | AG | 0.08 | 0.07 | 0.03 | 0.2 | 0.36 |
| DR | 0.09 | 0.08 | 0.32 | 0.16 | 0.4 | |
Table 3: Durations of the sound S1, S2 and systolic and diastolic phases.
A vigorous determination of the HMM parameters generate a clear segmentation of the PCG signals, this allows us directly to access the durations of the various components of the signal. Our HMM made it possibleto segment a large numberof PCG signals with global decision withoutthe obligation to use thresholds, however; it should also be noted that this algorithm is incapable of segmenting certain PCG signals (Figures 6-8).
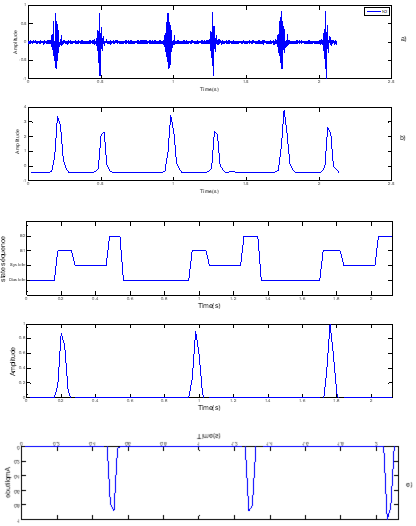
Figure 6. Segmentation of normal PCG signals. a) normal Signal PCG, b) standardized envelope by using homomorphic filtering c) localisation of S1 and S2 by HMM, d) sound S1, e) Sound S2

Figure 7. Segmentation of pathological SignalPCG case « MP »: mitral pro- lopase, a) Pathological SignalPCG (MP), b) standardized envelopeby using homomorphic filtering, c) localisation of S1 and S2 by HMM, d) sound S1, e) Sound S2.
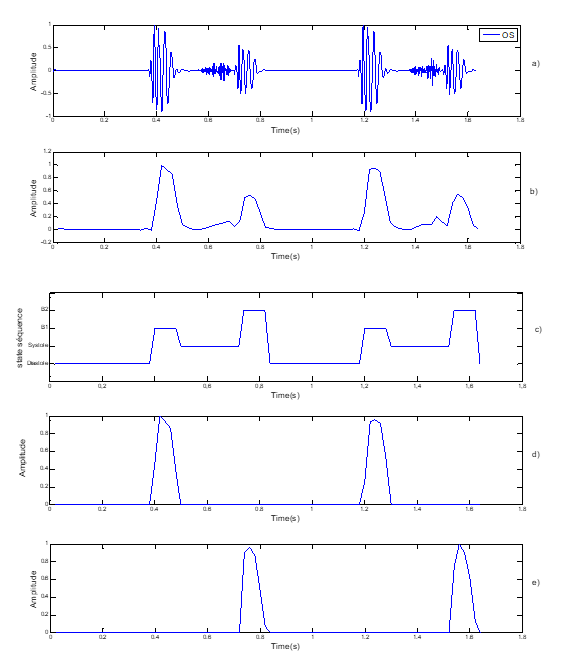
Figure 8. Segmentation of pathological Signal PCG case « OS »: Opening Snape,a) Pathological SignalPCG (OS), b) standardized envelopeby using homomorphic filtering, c) localisation of S1 and S2 by HMM
3.2 Severity analysis of the PCG signals
Better understand this phenomenon; we did an extended study to show the severity of systolic and diastolic murmurs and to assess their impact on heart rate variability, which can be considered an excellent factor for the general health of the human body.
Figure 9: Segmentation of pathological Signal PCG case « AS »: Aortic ste- nosi,
a) Pathological Signal PCG (AS), b) standardized envelope by using homomorphic filtering,
c) localisation of S1 and S2 by HMM, d) sound S1, e) Sound S2
The table 4 below shows the results beyond the calculation of RE for the case of AS and the same work was applied to the other pathologies SMP, Ms and AR. Certain characteristics were extracted in order to determine the impact of severity on heart rate variability, which is defined as the heart rate the inverse of the duration T between two successive peaks of the first heart sound S1 (fig.3) as given by the equation below:
| Subjects | ER % | Cycle duration (second) | Cardiac frequency Fc (Hz) | severity |
| 1 | 93.49 | 0.2477 | 4.03 | Severe |
| 2 | 91.5 | 0.2489 | 4.01 | Severe |
| 3 | 90 | 0.2521 | 3.93 | Severe |
| 4 | 89 | 0.2580 | 3.87 | Severe |
| 5 | 62 | 0.7863 | 1.2718 | Moderate |
| 6 | 49.8 | 0.8722 | 1.1494 | Moderate |
| 7 | 48.4 | 0.7863 | 1.2728 | Moderate |
| 8 | 48.2 | 0.6562 | 1.5352 | Moderate |
| 9 | 36.23 | 0.8688 | 1.1513 | Moderate |
| 10 | 36.05 | 0.8677 | 1.1524 | Moderate |
| 11 | 22 | 0.9684 | 1.0327 | Lightweight |
| 12 | 13.47 | 0.7875 | 1.2698 | Lightweight |
| 13 | 13.12 | 0.7760 | 1.2886 | Lightweight |
| 14 | 11.13 | 0.7627 | 1.3111 | Lightweight |
| 15 | 3.33 | 0.7475 | 1.3411 | Lightweight |
Table 4: Classification of severities according to the energy ratio RE for an aortic stenosis (AS).
The same work was done for the SMP, MS and AR cases. This study reveals that very interesting results can be organized on three points: the calculation of the severity of the murmur, the impact of this severity on cardiac variability and the link between the duration of the murmur on the cardiac cycle and its severity.
Figures 10 at Figure 13 present the influence of murmur severity ordering a murmur: light, moderate and severe on heart rate fluctuation. On the same figures (type b. figures) the curves present
Table 4 shows the effectiveness of using the RE energy ratio as an effective procedure for staging cardiac pathology between mild, moderate, and severe pathology, the latter requiring special monitoring and care or emergency medical intervention.
3.3 The impact of pathological severity on heart rate variability
The heart rate variability presented by the heart rate normally fluctuates around 1.2475 Hz for healthy people who do not present any pathology. the heart murmur in general affects this variability: according to figure 10 the heart rate of the AS case is not affected too much until the degree of murmur becomes severe, which means perceptible heartbeats and unpleasant This phenomenon is related to the damage of the aortic valve in which the surface of passage of blood flow is very reduced which leads to a low flow of blood to the whole body, for this purpose the heart catches up with blood circulation by a double effort to pump the blood through the body. Experts classify severe aortic stenosis as a very serious heart problem worldwide and unfortunately can lead to death in many cases. The heart rate of the ‘SMP’ and ‘AS’ cases increase according to the severity (figure 10 and Figure11), but it remains lower than the average value of a normal case, which led us to conclude that the severity of the systolic murmur affects the heart rate variability by increasing it. However, this influence depends on the pathology itself.
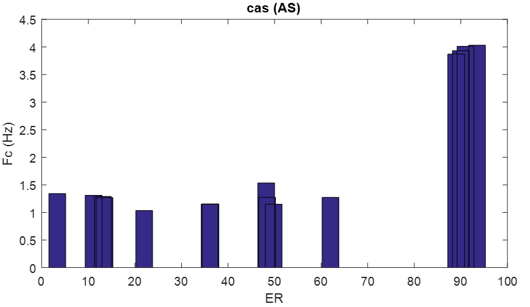
Figure 10: cardiac frequency according the severity of the “AS case”.by Histogramme representation
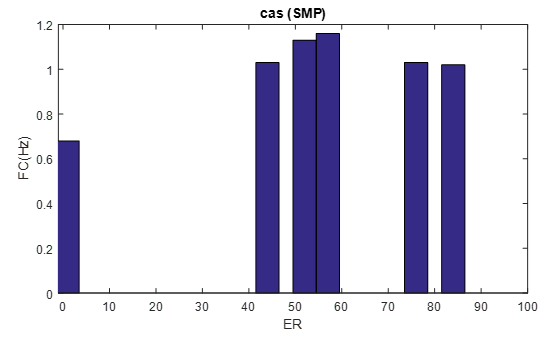
Figure 11: cardiac frequency according the severity of the “SMP case”.
By Histogramme representation
For the ‘MS’ and ‘AR’ cases (diastolic murmurs) shown in (Figure12 and Figure 13), they show a specific attitude in their curve whose heart rate increases at certain point and decreases again. This particular behavior is usually between 60% and 70%. From RE, where the heart rate is quite remarkable in this interval and slightly affected.
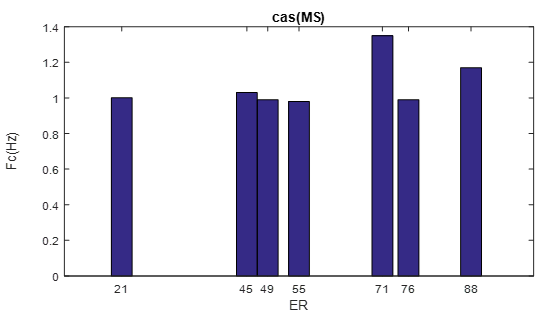
Figure 12: cardiac frequency according the severity of the “MR case”.
by Histogramme representation
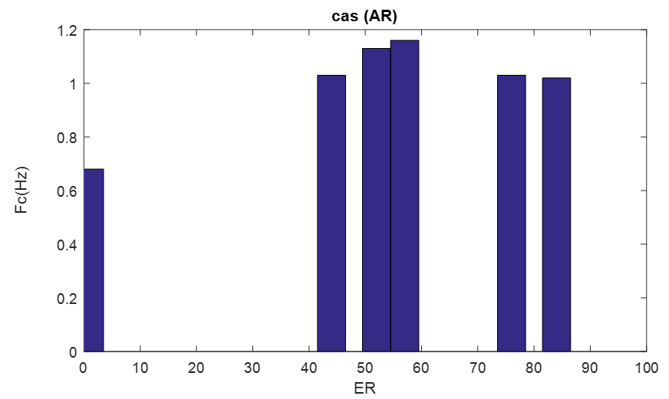
Figure 13: cardiac frequency according the severity of the “AR case”.
By Histogramme representation
Conclusion
The main objective of the work described in this paper was to develop a robust segmentation technique for segmenting the phonocardiogram into its main components. HMM’s PCG signal segmentation method generates excellent results, especially for pathological signalswith complex murmur morphology. The use of the homomorphic envelope is very important for the extraction of the characteristics which present the Markov model.
It is a method that eliminates pathological noises or sometimes attenuates them by comparing them to that of the sounds S1 and S2 which favors the maximization of probability of generating the best sequence of states.
Heart murmurs are a serious health problem worldwide and the phonocardiogram signal is a very interesting approach to extracting so much information about murmurs. In this study, we tried to focus on severity and its impact on heart rate variability. Energy ratio (ER) has been shown to be effective as an important process for calculating heart murmur severity stage and classifying it according to RE into mild, moderate and severe murmurs.
The study reveals a very interesting result regarding the influence of severity on heart rate where systolic murmurs increase it in a specific way depends on each case. However, it should be noted that a severe case of AS greatly affects the heart rate, which will lead to a very serious heart problem can lead to death. In addition, pathologies with diastolic murmurs have attracted attention by their particular variation in heart rate over a severity zone of 60% to 70%, which is due to the nature of the diastolic pathologies themselves.
In addition, it has been confirmed that the duration of the murmur cannot constitute an adequate criterion for judging the severity and must always be verified by another method.
"Compliance with Ethical Standards"
- No, I have nothing to report
- This study was not funded by any party: it is an academic PhD study
- No conflict of interest
- No animal or other used in this study
Acknowledgements
The authors would like to thank the Directorate-General of Scientific Research and Technological Development (Direction Générale de la Recherche Scientifique et du Développement Technologique, DGRSDT, URL:www.dgrsdt.dz, Algeria) for the financial assistance towards this research.
References
- Domart A, Bourneuf J. (1981). Nouveau Larousse Médical. Paris: Librarie Larousse.
View at Publisher | View at Google Scholar - Obaidat MS. (1993). Phonocardiogram signal analysis: Techniques and performance,comparison. J Med Eng Technol,17(6):221-227.
View at Publisher | View at Google Scholar - Tortora GJ, Grabowski SR. (2003). Principles of Anatomy and Physiology, Boudreault F, Boyer M, Desorcy MC (trans.), De Boeck Universite, Paris.
View at Publisher | View at Google Scholar - Benali R, Bouziani K. (2005). Temporal and spectral analysis of phonocardiogram signal, magister memory of biomédical electronic, Univ of Tlemcen, Algéria.
View at Publisher | View at Google Scholar - Pourazad M, Moussavi Z, Farahmand F, Ward R. (2005). Heart sounds separation from lung sounds using independent component analysis. Conf Proc IEEE Eng Med Biol Soc, 2736-2739.
View at Publisher | View at Google Scholar - Lehner RJ, Rangayyan RM. (1987). A three-channel microcomputer system for segmentation and characterization of the phonocardiogram. IEEE Trans Biomed Eng, 34(60):485-489.
View at Publisher | View at Google Scholar - Sepehri AA, Gharehbaghi A, Dutoit T. (2010). A novel method for pediatric heart sound segmentation without using the ECG. Computer Methods and Programs in Biomedicine, 99(1):43-48.
View at Publisher | View at Google Scholar - Nigam V, Priemer R. (2005). Accessing heart dynamics to estimate durations of heart sounds, IOP Publishing Ltd. Physiol Meas, 26(6):1005-1018.
View at Publisher | View at Google Scholar - Cherif LH, Debbal SM, Bereksi-Reguig F. (2008). Segmentation of heart sounds and heart murmurs. World Scientific Publishing Company. J Mec Med Biol, 8(4):549-559.
View at Publisher | View at Google Scholar - Tu Z, Cao G, Li Q, Zhang X, Shi J. (2010). Improved Methods for Detecting Main Components of Heart Sounds. Sixth International Conference on Natural Computation.
View at Publisher | View at Google Scholar - Xiao-Juan H, Jia-Wei Z, Gui-Tao C, Hong-Hai Z, Hao L. (2011). Feature extraction and choice in PCG based on Hilbert Transfer. 4th International Congress on Image and Signal Processing (IEEE).
View at Publisher | View at Google Scholar - Cherif LH, Debbal SM. (2013). Algorithm for detection of the S1 and S2 split and extraction of their internal components using a Hilbert transform. J Med Eng Technol, 37(3):220-230.
View at Publisher | View at Google Scholar - Lehner RJ, Rangayyan RM. (1987). A three-channel microcomputer system for segmentation and characterization of the phonocardiogram. IEEE Trans Biomed Eng, 34(6):485-489.
View at Publisher | View at Google Scholar - Groch MW, Domnanovich JR, Erwin WD. (1992). A new heart-sounds gating device for medical imaging. IEEE Trans Biomed Eng, 39(3):307-310.
View at Publisher | View at Google Scholar - Huiying L, Sakari L, Liro H. (1997). A heart sound segmentation using wavelet decomposition and reconstruction. Proceedings of the 19th Annual International Conference of the IEEE-EMBS, Chicago, 1630-1633.
View at Publisher | View at Google Scholar - Sarkady AA, Clarck RR, Williams R. (1976). Computer analysis techniques for phonocardiogram diagnosis. Comput Biomed Res, 9(4):349-363.
View at Publisher | View at Google Scholar - Liang H, Lukkarinen S, Hartimo I. (1997). A boundary modification method for heart sound segmentation algorithm. Computers in Cardiology, 25:593-595.
View at Publisher | View at Google Scholar - Gill D, Intrator N, Gavriely N. (2006). A Probabilistic Model for Phonocardiograms Segmentation Based on Homomorphic filtering. Biosignal.
View at Publisher | View at Google Scholar - Gill D, Gavrieli N, Intrator N. (2005). Detection and Identification of Heart Sounds Using Homomorphic Envelogram and Self-Organizing Probabilistic Model. Computers in Cardiology, 32:957-960.
View at Publisher | View at Google Scholar - Schmidt SE, Holst-Hansen C, Graff C, Toft E, Struijk JJ. (2010). Segmentation of heart sound recordings by a duration-dependent hidden Markov model. Physiol Meas, 31(4):513-529.
View at Publisher | View at Google Scholar - Young S, Evermann G, Kershaw D, Moore G, Odell J, Ollason D, et. al. (2002). The HTK Book (for HTK Version 3.2.1). Cambridge University Engineering Department.
View at Publisher | View at Google Scholar - Anguera X, Bozonnet S, Evans N, Fredouille C, Friedland G, Vinyals O. (2010). “Speaker Diarization: A Review of Recent Research”. IEEE TASLP.
View at Publisher | View at Google Scholar - Forney GD Jr. (0225). “The Viterbi Algorithm: A Personal History.
View at Publisher | View at Google Scholar - Jurafsky D, James H. Martin. (2009). Speech and Language Processing.
View at Publisher | View at Google Scholar - Ludovic Melly, Christoph Huber, Dominique Delay, Frank Stumpe La valve aortique sous toutes ses forms, Forum Med Suisse, (2009). 9(4):73-78
View at Publisher | View at Google Scholar - Robert O. Bonow , Blase A. Carabello , Kanu Chatterjee, Antonio C. de LeonJr, David P. Faxon, Michael D. Freed, William H. (2008). Gaasch, the ACC/AHA 2006 Guidelines for the Management of Patients With Valvular Heart Disease. J. Circulation., 118:523-661
View at Publisher | View at Google Scholar - Kim D1, Tavel ME. (2003). Assessment of severity of aortic stenosis through time-frequency analysis of murmur.J americain college of , 124(5):1638-1644.
View at Publisher | View at Google Scholar - F. Meziani, S. M. Debbal, and A. Atbi. Analyse du Degré de Sévérité Pathologique de La sténose aortiques(AS) par Application de La transformée en Ondelettes Continue (TOC), a l‟occasion de : International Conférence on MultiMedia Information Procession.
View at Publisher | View at Google Scholar - Thomas R, Ling Lieng Hsi, Soh Cheong Boon, Gunawan E. (2016). Classification of severity of mitral regurgitation patients using multifractal analysis, 6226-6229.
View at Publisher | View at Google Scholar - American college of cardiology.
View at Publisher | View at Google Scholar - J.Talha, HA.Ahmad and AK.Shoab. (2009). Classification of Phonocardiogram using an Adaptive Fuzzy Inference System. Proceedings of International Conference on Image Processing, Computer Vision (IPCV), Monte Carlo Resort, LasVegas, Nevada, USA, 609-614.
View at Publisher | View at Google Scholar - M.Omari Taher. (2009). étude de degré de sévérité pathologique des sténoses aortique; mémoire Magister en électronique biomédical, université de Tlemcen, juin.
View at Publisher | View at Google Scholar - F. Meziani, S. M. Debbal, and A. Atbi. (2013). Analysis of the pathological severity degree of aortic stenosis (AS) and mitral stenosis (MS) using the discrete wavelet transform (DWT), Journal of Medical Engineering & Technology, 37(1): 61-74.
View at Publisher | View at Google Scholar - Scarsini R1, Cantone R. (2019). Correlation between intracoronary physiology and myocardial perfusion imaging in patients with severe aortic stenosis. Int J Cardiol. 276-316.
View at Publisher | View at Google Scholar - Heart Sounds and Murmurs.
View at Publisher | View at Google Scholar - https://newheartvalve.com/understand-aortic-stenosis/dangers-severe-aortic-stenosis/
View at Publisher | View at Google Scholar
