

Research Article | DOI: https://doi.org/10.31579/2834-5029/009
Body Mass Index (BMI) versus Waist-Height Index (WHI) and Weight-Waist (WW) Circumference Index (IPCC), in children from Caracas
- Gerardo José Bauce *
- Mary Zulay Moya-Sifontes
Profesor de Estadística y Metodología. Escuela de Nutrición y Dietética. Universidad Central de Venezuela.
*Corresponding Author: Gerardo José Bauce, Profesor de Estadística y Metodología. Escuela de Nutrición y Dietética. Universidad Central de Venezuela.
Citation: Gerardo José Bauce, Mary Zulay Moya-Sifontes (2023). Body Mass Index (BMI) versus Waist-Height Index (WHI) and Weight-Waist (WW) Circumference Index (IPCC), in children from Caracas. International Journal of BioMed Research , 2(1): DOI: 10.31579/2834-5029/009
Copyright: © 2023. Gerardo José Bauce, This is an open-access article distributed under the terms of the Creative Commons Attribution License, which permits unrestricted use, distribution, and reproduction in any medium, provided the original author and source are credited.
Received: 22 December 2022 | Accepted: 11 January 2023 | Published: 19 January 2023
Keywords: body mass index; waist-height index; weight-waist circumference index; sensitivity; specificity; kappa coefficient
Abstract
The objective is to compare BMI, WSI and WCWI to evaluate overweight and obesity, in children aged 6 to 12 years, from Caracas. MATERIALS AND METHODS: It is a descriptive, cross-sectional, prospective and correlational study in a sample of 422 boys (50.2%) and girls (49.8%); the variables sex, age, weight, height, BMI, WSI and WWCI, were measured and obtained. RESULTS: the classification percentages for the three indicators differ, in Deficit the lowest corresponds to BMI/CCS; in Normal the percentages are similar; in Overweight, the differences are greater but not significant between BMI/WHO and BMI/CCS; significant between BMI/WHO and WSI, BMI/CCS and WSI; BMI/WHO/WWCI and BMI/CCS and IPCC (p<0.001); and in Obesity they are similar, and significant between WSI and WWCI (p<0.04). Correlations are similar for boys and girls. The sensitivity of WSI equals for BMI/WHO and BMI/CCS, and for the WWCI higher for BMI/WHO in boys and for BMI/CCS greater in girls. The Kappa index between WSI and BMI/CCS is 0.16 higher than that of WSI and BMI/WHO; for the WWCI and BMI/CCS it is 0.42 considered as a good agreement. Logistic Regression differs in the area under the curve, which is for the WWCI 0.996 greater than that of the WSI. CONCLUSION: BMI is a useful indicator to assess overweight and obesity; The WSI and WWCI indicators may be useful in age groups such as the one analyzed in this study, as they classify similar, statistically non-significant percentages with overweight and obesity. Ethiopia.
Introduction
Evaluating childhood overweight and obesity is a somewhat complicated process because these as they are in continuous growth, both their weight and their height, vary in very short periods of time, which makes it difficult to have a reliable measure of the changes that can occur in such anthropometric variables and therefore in the indicators that can be obtained from the combination of them; on the other hand, abdominal fat is also modified, so that the values of the waist circumference also turn out to be unreliable, due to the constant changes they usually present. Considering that the amount of fat changes with age, this makes it more difficult to interpret BMI; It is also known that girls and boys have different amounts of body fat, considering that they grow at different speeds, which does not make it easy to know when they are overweight or obese [1].
On the other hand, the evaluation of overweight or obesity in children depends on the growth curves suggested by the WHO, which are associated with age, and based on the percentiles of BMI [2,3].
Considering that the prevalence of overweight and obesity in children and adolescents has increased dramatically, from 4Percentage in 1975 to more than 18Percentage in 2016 3, it is necessary to have indicators that are reliable to identify cases of overweight and obesity, particularly in children, taking into account that experts estimate that 80Percentage of obese children and adolescents will continue to be obese when they reach age. adult, if appropriate measures are not taken [4].
In Venezuela there are few studies that indicate the prevalence of overweight and obesity in the country, a study conducted in Maracaibo, Zulia state, reveals a prevalence of overweight of 9.5Percentage and obesity of 4.3Percentage in children from 6 to 12 years 5; Another study conducted in several cities, revealed that the prevalence of obesity is 58.5Percentage in boys in the state of Aragua and 30Percentage in girls, and together for all cities the prevalence of overweight and obesity is 40Percentage, on the other hand, Caracas showed a prevalence of obesity of 29.3Percentage in boys and 16.7Percentage in girls [6]. Due to this situation, there is a need to incorporate other indicators, other than BMI, that may be useful to evaluate overweight and obesity in children, such as the Waist-Size Index (WSI) and the Weight-Waist Circumference Index (WWCI), and complement the evaluation obtained through BMI.
Methodology
It is a prospective, cross-sectional, descriptive and correlational study, based on a sample of 422 children aged between 6 and 12 years, of which 187 (50.2Percentage) male and 174 (49.8Percentage) female, who attended an educational institution in Caracas. The variables, sex, age, weight, height were measured and obtained the indicators BMI, WSI and WWCI, which were chosen because they had at least one element in common in their calculation. The WSI is used to evaluate abdominal fat in children [7], and as an identifier of childhood overweight and obesity [8]; likewise, the sensitivity and specificity of ICT as an identifier of childhood overweight and obesity has been determined [9]. While the IPCC, is used as a complementary indicator of overweight and obesity in different groups of subjects, which include children and adolescents [10].
The representatives of these children were asked for informed consent, after explanation, both parents and representatives, as well as teachers, the objective of the investigation; and the weighing, measurement and collection of information was carried out by teaching staff and students of the School of Nutrition, who were trained and standardized, in order to standardize criteria. BMI was calculated, using Quetelet's formula, the WSI was obtained by dividing the WC by the Height and the WWCI was obtained by dividing the weight by the WC; that is, the calculation formulas for each indicator are:
For BMI [11], BMI=W(kg)/S(m)2
For WSI [12], WSI=WC/S
For WWCI [13], WWCI=W(kg)/WC(cm)
As criteria for classifying boys and girls, the following are considered:
For BMI, the values suggested by the CDC [14] and the BMI/Age curves suggested by WHO [15]:
BMI < p5>
For the WSI and the WWCI, the same percentages are considered, in order to be able to make a more equitable comparison in terms of Overweight and Obesity,
Descriptive measures such as averages, deviation, percentages; association measures such as Chi square; Correlations, T-test for mean differences, Logistic Regression and Kappa Coefficient of Concordance.
Results
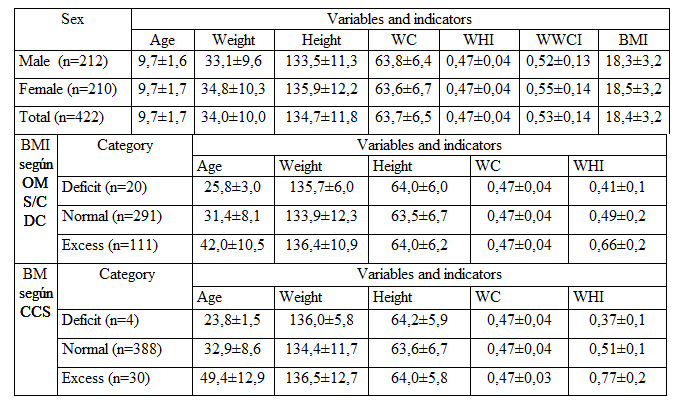
Below are the averages and deviation of the variables, which characterize the study group, and it is necessary that the averages of all the variables are similar in the two sexes, in addition to being similar in terms of dispersion. The comparison of the averages by sex, by applying the Student's t-test, for independent samples, turned out to be statistically non-significant (Table 1). The average weight increases, depending on the category; the size is slightly higher in the Deficit category, decreases in the Normal category and then increases in the Excess category, according to the two criteria of BMI; the indicators have similar averages in all three categories, with the exception of the WWCI average which increases slightly as it passes from the Deficit category to the Normal category and increases considerably in the Excess category (Table 1).
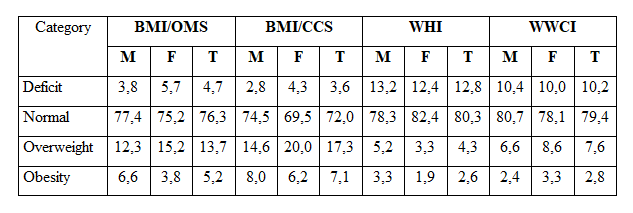
From the results presented in Table 2, it can be stated that for all categories, the percentages differ significantly. In the Deficit category, the percentages vary between 3.6Percentage and 12.8Percentage, with the lowest corresponding to the CCS indicator and the highest to the WSI indicator; in the Normal category, the percentages are similar, although a higher percentage corresponds to the WSI indicator (80.3Percentage); in the Overweight category, differences ranging from 4.3Percentage for WSI to 17.3Percentage for BMI/CCS were observed; and in the Obesity category there are also differences ranging from 2.6Percentage for WSI to 7.1Percentage for BMI/CCS. When comparing the percentages in the Overweight category, it was obtained as a result that for the indicators BMI/Age and BMI/CCS they are not statistically significant (p<0>
When discriminating against boys and girls, it has to be that for the Normal category, the four indicators have similar percentages; in the Overweight category, BMI/WHO is slightly higher in girls; the BMI/CCS indicator the percentage is much higher in girls; the WSI indicator the percentage is higher in boys and for the WWCI indicator the percentage is higher in girls. In the Obesity category for the BMI/WHO, BMI/CCS and WSI indicators, the percentage is higher in boys, and for the WWCI indicator the percentage is higher in girls (Table 2).
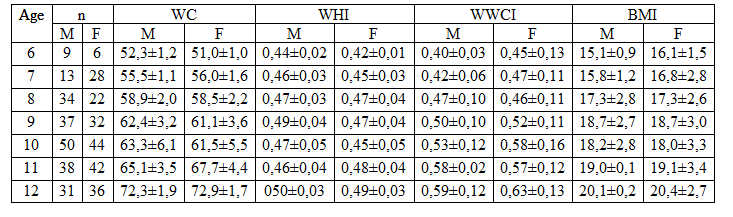
The averages of the indicators were obtained, by age and sex, and it can be observed that for the Waist Circumference they increasewith age, in boys and girls; for WSI it increases to 9 years in boys and girls, decreases to 11 years in boys and up to 10 years in girls, and then increases to 12 years (Table 3).
Boys and girls of Caracas
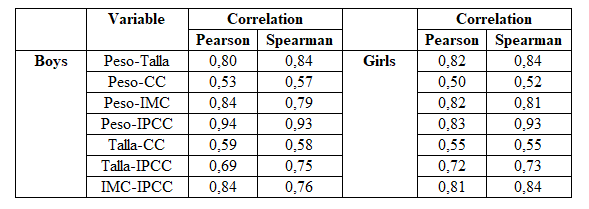
The bivariate correlations, by Pearson and Spearman, between the variables, result in the similarity, with the exception in boys, that the correlation between Size-WWCI is greater than that of Spearman, and in girls the Weight-WWCI correlation is greater than that of Spearman (Table 4).
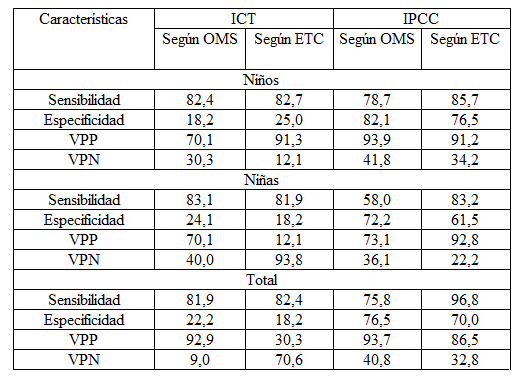
The cross tables between BMI and the WSI and WWCI indicators were used to obtain the characteristics of the WSI and WWCI indicators, for the two criteria of BMI/Age, that is, sensitivity, specificity, positive predictive value and negative predictive value, for boys, girls and the total. It is necessary that in children, the sensitivity of the WSI is equal for the two criteria
of BMI / Age, the specificity and the positive predictive value is higher in
the BMI / Age criterion according to CCS and the negative predictive value is higher in the BMI / Age criterion according to WHO; in girls, according to the WHO criterion, the sensitivity, specificity and positive predictive value is higher, and the negative predictive value is higher according to the CCS criterion. For the WWCI indicator, it is that in children, according to the WHO criterion, the specificity, sensitivity and positive predictive value are higher; and in girls, according to the CCS criterion they are higher, the sensitivity and positive predictive value are higher (Table 5).
Cohen's weighted Kappa index, obtained between the BMI/CCS classification and the WSI classification, has a value of 0.161 which is higher than that obtained between BMI/Age (WHO) and WSI, although neither can be considered as a good agreement between these indicators. Likewise, Cohen's weighted Kappa index, obtained between the BMI/CCS classification, according to the criteria of the Venezuela Project, and the WWCI classification, has a value of 0.423 which can be considered as a good agreement between the two indicators used to classify children. Logistic Regression applied to each of the indicators resulted in the ROC curves differing in terms of the area under the curve, highlighting the curve for the WWCI indicator with an area under the curve equal to 0.996 (Figures 1-4).
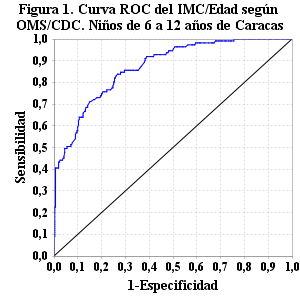
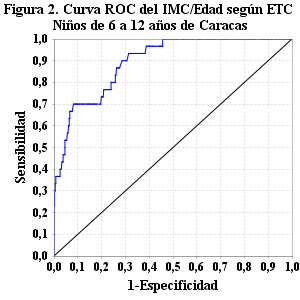
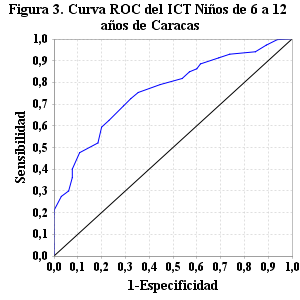
Figure 1-4: Curvas ROC de los indicadores IMC/OMS, IMC/ETC, ICT e IPCC Niños y niñas de Caracas 2
Discussion
The consideration of other indicators to evaluate overweight and obesity in children is very useful, because it allows to have another measure, other than BMI, to diagnose more properly if the child is overweight or obese; that is why the indicators Waist Circumference (WC), Waist-Height Index (WHI) and Weight-Waist Circumference Index (WWCI) were included in a group of children aged 6 to 12 years, as a way to perform a Nutritional Risk Assessment 18. Results were obtained for boys and girls, with equal averages, which shows that for this ethereal group there is no sexual dimorphism, and it is evidenced in the fact that the averages of WC and WHI are the same, that is, the accumulation of abdominal fat is practically the same in the two sexes [19]; particularly the averages of the WC are lower than those obtained by Mederico et al [20], who obtained 68.13 and 66.3 for male and female, respectively, and significant. Just as weight and height increase with age; however, when discriminating by age and sex, it is observed that all indicators increase with age, and reach their maximum value at 12 years, the age at which pubertal change begins and consequently sexual dimorphism [21]. The WHI with an average of less than 0.5 was observed in 76.5Percentage, a percentage higher than that observed by Valle-Leal et al in an age group equal to that of this study, which was 39Percentage [21]. The classification of WHI, according to the two criteria of BMI, is similar in percentage in Normal and in boys and girls; however, in Overweight there are 4.3Percentage and in Obesity 2.6Percentage, percentages lower than those obtained with BMI/WHO and BMI/CCS; when excess is evaluated, there are 6.4Percentage of children aged 6 to 8 years, lower than reported by Matos-Imbert et al [22] and 19.6Percentage in boys and girls aged 9 to 12 years, older.
In relation to the WWCI, it has to classify 7.6Percentage with Overweight and 2.8Percentage with Obesity, values slightly higher than those reported by Bauce et al [23], who report 6.8Percentage with Overweight and 4.0Percentage with Obesity; when excess is evaluated, there are 0.8Percentage of boys and girls from 6 to 8 years old and 14.5Percentage of boys and girls from 9 to 12 years old. It has that 15.2Percentage are classified in Excess, percentage higher than that reported by Bauce et al [23], who report 7.8Percentage in Excess, BMI / Age classifies 26.3Percentage of boys and girls with excess, and of them girls prevail in Overweight with 24.8Percentage, while boys prevail in Obesity with 6.6Percentage; results that coincide with what was reported in Mexico, in boys and girls from 6 to 11 years old, with prevalence of Overweight in girls 20.6Percentage, although a lower percentage [24].
The WHI and WWCI indicators have high Sensitivity in boys and girls, and similar in the WHI for the BMI/WHO and BMI/CCS criteria, and the WWCI higher Sensitivity for the BMI/CTE criterion in boys and girls. In relation to specificity, this differs and is much lower for WHI, while for the WWCI it is higher in children for the BMI/WHO criterion. The positive predictive value of WHI was found to be higher in children, with the BMI/WHO criterion and for the WWCI higher in boys and girls with the BMI/WHO criterion, although it is high for the two BMI criteria.
Conclusion
Given the results, it can be said that BMI remains the most useful indicator to assess overweight and obesity in boys and girls aged 6 to 12 years; However, considering that this is still a public health problem, it seems logical to try another indicator such as the one included here, The two indicators, WHI and WWCI, turn out to be useful since for this study group they classify similar percentages, statistically not significant, with Overweight and Obesity; has a high correlation with BMI/Age according to both criteria. It has a Sensibility for the group greater than 75.0; in the case of the WWCI a Specificity greater than 70.0 and a Positive Predictive Value greater than 86.5. Given these characteristics, the use of these indicators is recommended, with the purpose of validating them in similar age groups. Cohen's weighted Kappa index, obtained between the BMI/CCS classification, and the WWCI classification, has a value of 0.423 which can be considered as a good agreement between the two indicators used to classify children.
References
- (2021). MedlinePlus. Obesidad en niños.
View at Publisher | View at Google Scholar - de Onis Merceses. (2021). Valores de referencia de la Organización Mundial de la Salud. ECOG.
View at Publisher | View at Google Scholar - (2021). Organización Mundial de la Salud. Centro de Prensa. Obesidad y sobrepeso.
View at Publisher | View at Google Scholar - Organización Mundial de la Salud. (2016). Informe de la Comisión para acabar con la obesidad infantil.
View at Publisher | View at Google Scholar - Di Gianfilippo Martha, Calvo María José, Chávez Mervin, Chacín Yariana, Añez Roberto, et al. (2013). Prevalencia de sobrepeso y obesidad en escolares de la parroquia Coquivacoa del municipio Maracaibo – Venezuela. Revista Latinoamericana de Hipertensión. Vol. 8 - Nº 3.
View at Publisher | View at Google Scholar - Marianella Herrera Cuenca; Jesús Velásquez; Greta Rodríguez, Mariela Berrisbeitia; Néstor Abreu; et al. (2013). Obesidad en escolares venezolanos y factores de riesgo para el desarrollo de diabetes tipo 2. An Venez Nutr. 26(2): 95-105.
View at Publisher | View at Google Scholar - Valle-Leal Jaime, Abundis-Castro Leticia, Hernández-Escareño Juan, Flores-Rubio Salvador. (2016). Índice cintura-talla como indicador de riesgo metabólico en niños. RevChilPediatr. 87(3):180---185.
View at Publisher | View at Google Scholar - Saldívar-Cerón, HI, Vázquez-Martínez, AL, & Barrón-Torres, MT. (2021). Precisión diagnóstica de indicadores antropométricos: perímetro de cintura, índice cintura-talla e índice cintura-cadera para la identificación de sobrepeso y obesidad infantil. Acta pediátrica de México, 37(2), 79-87.
View at Publisher | View at Google Scholar - Marrodán MD, Martínez-Álvarez JR, González-Montero de Espinoza M, López-Ejeda N, Cabañas MD, et al. (2013). Precisión diagnóstica del índice cintura-talla para la identificación del sobrepeso y de la obesidad infantil. Medicina Clínica. 140(7): 296-301.
View at Publisher | View at Google Scholar - Bauce Gerardo, Moya-Sifontes Mary Zulay. (2020). Índice Peso Circunferencia de Cintura como indicador complementario de sobrepeso y obesidad en diferentes grupos de sujetos. Rev Digit Postgrado. 9(1): e195.
View at Publisher | View at Google Scholar - Carbajal Azcona A. (2013). Manual de Nutrición y Dietética. Universidad Complutense de Madrid. Facultad de Farmacia. Departamento de Nutrición.
View at Publisher | View at Google Scholar - Moreno C. M. (2012). Definición y Clasificación de la Obesidad. Rev. Med. Clin. Condes, 23(2): 124-128.
View at Publisher | View at Google Scholar - Bauce G. (2018). Three indicators for overweight and obesity: BMI, CC and P/CC-index in children and adolescents: Pilot study. MOJ Biology and Medicine. Volume 3 Issue 3.
View at Publisher | View at Google Scholar - (2021). Centros para el Control y la Prevalencia de Enfermedades (CDC). Acerca del índice de masa corporal para niños y adolescentes.
View at Publisher | View at Google Scholar - WHO. (2006). Child Growth Standarsds. Methods and development.
View at Publisher | View at Google Scholar - López M, Landaeta M. (1991). Manual de crecimiento y desarrollo. Caracas: Fundacredesa.
View at Publisher | View at Google Scholar - Fundacredesa. (1996). Estudio Nacional de Crecimiento y desarrollo Humanos de la República de Venezuela. Proyecto Venezuela. Caracas, Venezuela.
View at Publisher | View at Google Scholar - Suverza Fernández Aracelis, Haua Navarro Karime. (2021). El ABCD de la Evaluación del Estado de Nutrición. McGraw-Hill Interamericana Editores S. A. México S/F.
View at Publisher | View at Google Scholar - Marrodán Serrano, Romero Collazos, Moreno Romero, Mesa Santurino, Cabañas Armesilla, et al. (2021). Dinamometría en niños y jóvenes de entre 6 y 18años: valores de referencia, asociación con tamaño y composición corporal.
View at Publisher | View at Google Scholar - Mederico Maracally, Paoli Mariela, Zerpa Yajaira, Briceño Yajaira, Gómez-Pérez Roald, et al. (2013). Valores de referencia de la circunferencia de la cintura e índice de la cintura/cadera en escolares y adolescentes de Mérida, Venezuela: comparación con referencias internacionales. Rndocrinología y Nutrición. Vol. 60. Núm.5. páginas 235-242.
View at Publisher | View at Google Scholar - Valle-Leal Jaime, Abundis-Castro Leticia, Hernández-Escareño Juan, Flores-Rubio Salvador. (2021). Índice cintura-estatura como indicador de riesgo metabólico en niños. Revista Chilena de Pediatría. Vol. 87. Núm. 3. Páginas 180-185.
View at Publisher | View at Google Scholar - Matos Imbert Ángela M, Blanco Jiménez Jairo, Rodríguez Xiomara, De La Mota Carina, Fernández Genao Alina, et al. (2021). Índice Cintura-Talla e Índice de Masa Corporal como predictores de riesgo cardiometabólico en niños y adolescentes. Ciencia y Salud, Vol. V, No. 2, mayo-agosto.
View at Publisher | View at Google Scholar - Bauce G, Moya-Sifontes M. (2020). Índice Peso Circunferencia de Cintura como indicador complementario de sobrepeso y obesidad en diferentes grupos de sujetos. Rev Digit Postgrado. 9(1): e195.
View at Publisher | View at Google Scholar - Unicef para cada niño. (2018). Informe Anual UNICEF México.
View at Publisher | View at Google Scholar
