

Review Article | DOI: https://doi.org/DOI:10.31579/2835-835X/046
Stereochemical of Atorvastatin Drug by Using Spectroscopic Analysis
Bioactive Molecules and Chiral Separation Laboratory, Faculty of exact sciences, Tahri Mohammed University, Istiklal street PO 417 Bechar, 08000, Algeria.
*Corresponding Author: Thinhinane HAMACHE, E-mail Address: hamache.thinhinane@univ-bechar.dz Tel.: +2130675309012.
Citation: Thinhinane HAMACHE, Nasser BELBOUKHARI, and Khaled SEKKOUM, (2023), Stereochemical of Atorvastatin Drug by Using Spectroscopic Analysis, Clinical Trials and Case Studies, 3(1); DOI:10.31579/2835-835X/046
Copyright: © 2023, Thinhinane HAMACHE. This is an open-access artic le distributed under the terms of the Creative Commons Attribution License, which permits unrestricted use, distribution, and reproduction in any medium, provided the original author and source are credited.
Received: 02 December 2023 | Accepted: 20 December 2023 | Published: 03 January 2024
Keywords: atorvastatin; UV; Infrared; H1NMR spectroscopy; chirality; diastereoisotopic
Abstract
Spectrophotometric analysis is still one of the most commonly used analytical techniques. In this study, a various and sensitive Spectrophotometric methods have been reported for the determination of Atorvastatin in its pharmaceutical form. Among this analysis UV were carried out using methanol as solvent, the absorption maxima were found to be at 205, 246 and 285 nm. Furthermore, a precise, rapid, FTIR spectroscopy method was developed which is usually applied as an identification method, except for grinding for the acquisition of the FT-IR spectra, no sample preparation was required. The chirality of the atorvastatin molecule then leads us through a nuclear magnetic resonance (H1NMR) spectroscopy to determine the diastereoisotopic protons.
Introduction
Hyperlipidemia is characterized by an unusually high level of lipids in the blood and is a major risk factor for a number of cardiac issues, including atherosclerosis and stroke. All etiologies are characterized by elevated levels of blood cholesterol, primarily low-density lipoprotein (LDL) and/or triglycerides. Statins are first-line treatments for hyperlipidemia [1, 2].
Statins bind to HMG-CoA reductase at nanomolecular quantities, causing dislocation of HMG-CoA, the natural substrate of this enzyme. There are currently seven statins on the market worldwide, all of which are deemed safe and well tolerated by the body, including Atorvastatin (Figure 01). The major function of atorvastatin is to reduce LDL cholesterol by inhibiting HMG-CoA reductase through a mevalonic acid-like moiety. As a result, inhibits a first and crucial rate-limiting step in cholesterol production in the liver [3, 4].
It is chemically defined as [R- (R*, R*)]. [(phenyl amino) carbonyl] -2-(4-fluorophenyl)-b, d-dihydroxy-5-(1-methylethyl) [(phenyl amino) carbonyl], Its chemical formula C33H35FN2O5 and is very barely soluble in distilled water, pH 7.4 phosphate buffer, and acetonitrile; it is slightly soluble in ethanol; and it is freely soluble in methanol [5, 6]. For the determination of atorvastatin in pharmaceutical form, in individual formulations and combined with other active ingredients, various analytical methods have been described, including spectrophotometric methods [7, 8]; notably: Vis-UVS spectrophotometry, INFRARD, H1NMR; Vis-UV spectroscopy is one of the methods of choice for the determination or quantification of a single component in pharmaceutical preparations. The reasons for this stem from the ease, their sensitivity and precision which most spectrophotometric measurements can be made [9,10].
Furthermore, determining the molecular structure may be greatly aided by IR spectroscopy. The IR spectrum of an organic substance is like a fingerprint; it can be used to identify a substance by comparison with previously recorded reference spectra or to demonstrate significant structural elements of the molecules with intense vibration bands [2, 3]
For chemical analysis, nuclear magnetic resonance (NMR) spectroscopy is a useful instrument. Because the spectrum displays distinctive peaks that correlate to the various types of hydrogen atoms in the compound, this provides important information on the chemical environment and structure of the molecule [10, 11].
the aim of this work is to determine the stereochemical of atorvastatin in its pharmaceutical form by using Spectrophotometric methods such as UV, FTIR, HNMR specifically to determine the diastereoisotopic protons.

Figure 1: Chemical structure of Atorvastatin
II Experimental Method
The Vis-UV- spectrophotometry the preparation of sample solutions involved the powdering and precise weighing of 0,05 mg of Atorvastatin® 40 mg. The powder was dissolved in methanol to a volume of 20 ml. The device used in this work was of the “Specord 50 plus” brand. This new dual-beam UV/Vis photometer for the spectral range from 190 to 1100 nm combines high energy through put with best stability. we carried out a scanning in an interval going from 200 nm to 400 nm controlled by the software. and regarding the infrared method which is created and used as an identification method. A "Cary 630 FTIR " brand device was utilized with No sample preparation was necessary, with the exception of grinding for the FT-IR spectra to be acquired. The chirality of the atorvastatin molecule then leads us through a nuclear magnetic resonance (HNMR) spectroscopy to determine the diastereoisotopic protons by using the master Nova software
III. Results and Discussion:
UV-Vis spectroscopic analysis:
The specter of absorption visible UV of Atorvastatin in methanol present three characteristic bonds of absorption present in (Figure 02) and Table I.

Figure 2: UV-absorbance spectra of Atorvastatin

Table 1: Result of Vis-UV spectroscopic analysis of Atorvastatin
III.A.b. Discussion:
Using the Beer-Lamber absorption law, we can calculate the molecular extinction coefficients, which provide information on the intensities of the absorption bands.
- The first bond located at λmax =205 nm attributed to electronic transition п→п⁎ with an energy about Δ=139.592 kcal/mol and ε= 1118 which corresponds to the double aromatic links between both (C=C).
- The second bond situated at λmax = 246 nm attributed to electronic transition п→п⁎ with an energy about 116,327 Kcal/mol and ε= 543,2 which corresponds to the double links between both (C=O).
- The third bond situated at λmax= 285 nm with attributed to electronic transition n→п⁎ with an energy about 102,202 Kcal/mol and ε= 240 due to the presence of the free doublet of heteroatom (C=O, C -N).
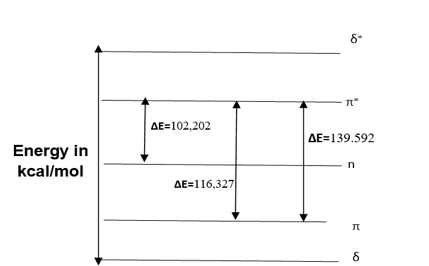
Figure 3: Energy diagram of Atorvastatin
According to the Atorvastatin energy diagram (Figure 03), the electronic transition energy is inversely related to the wavelength, so as the transition energy decreases, the wavelength of the corresponding increases; this observation provides information on the molecule's stability based on the number of existing intramolecular interactions.
III.B.a. IR spectroscopic analysis:
An IR spectrometry was used to get the infrared absorption spectrum of atorvastatin. The spectrum is depicted in Figure 04, and a brief table 02 of peak assignments.
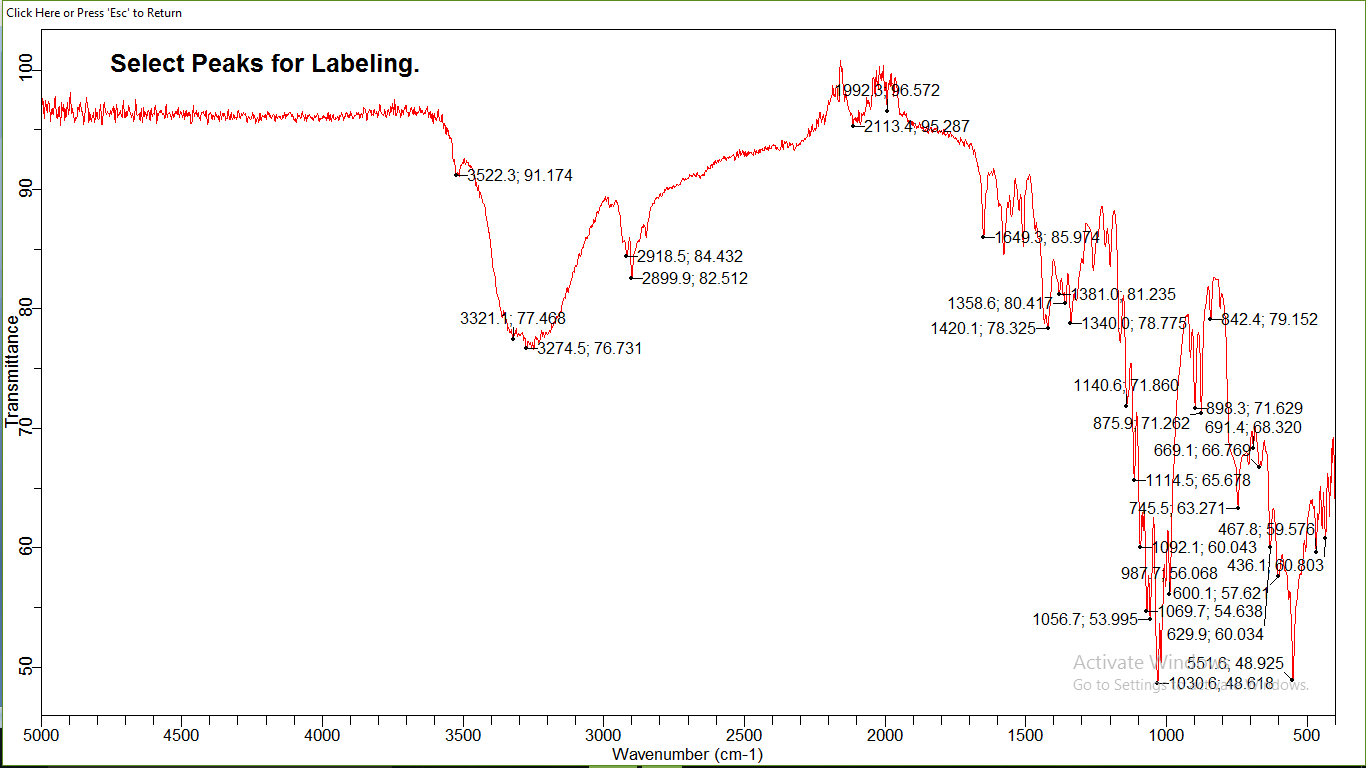
Figure 4: The infrared spectrum (IR) of Atorvastatin

Table 2: Results of the infrared spectrum (IR)
III.B.b. Discussion:
- The infrared spectrum of atorvastatin presents 18 characteristic absorption bands;
- Four thin bands are located respectively at 2850; 2899; 2918; 2920 cm-1 correspond to the symmetric and asymmetric valence vibrations of the CH bonds of CH2 and CH3 (Table 02), this is confirmed by the presence of two absorption bands located around 1358; 1381 cm-1corresponds to the deformation vibrations in the same symmetrical and asymmetrical plane of the CH bonds of CH2 and CH3, and also by the presence of two fine absorption bands are located around 700; 747 cm-1 attributed to out-of-plane deformation vibrations of the CH and CH2 connections.
- A band located at 1420 cm corresponds to the vibration of the aromatic C=C bond, the aromacity is confirmed by the presence of two absorption bands around 669; 690, attributed to deformation vibration outside the aromatic C-H bond plane.
- A characteristic absorption band located at 1992 corresponds to the carbonyl bond valance vibration C=O.
- The amide function is characterized by the presence of a fine gap and intensity around 3522 cm attributed to the valance vibration of the N-H bond and this is confirmed by the presence of an absorption band located at 1649 cm due to the vibration of deformation in the same plane of N-H bonds and intensity band around 3522 cm attributed to the valance vibration.
- of the N-H bond and this is confirmed by the presence of an absorption band located at 1649 cm due to the vibration of deformation in the same plane of N-H bonds.
- Is The carboxylic acid function is characterized by the presence of a band located around 1140 cm corresponding to the vibration of the C-O bond valence, this is confirmed by the presence of a very wide band from 3500 to 2540 cm-1 corresponds to the vibration of the assigned valence at the O-H bond carbonyl acid.
III.C.a. HNMR spectroscopic analysis:
The determination of the structure of Atorvastatin, based on the H1NMR spectra, indicate the presence of 31 signals showed in Figure (05).

Figure 5: HNMR spectrum of Atorvastatin
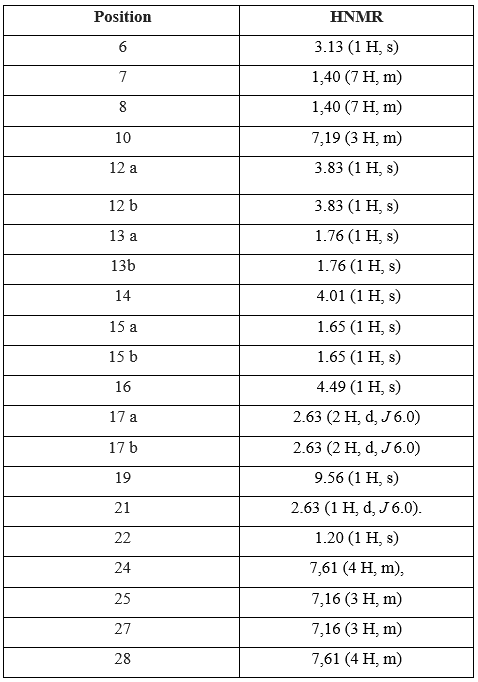
Table 3: Chemical shifts in H1NMR and the attribution of Repaglinide signals
III.C.b. Discussion:
The H1NMR spectrum analysis of Atorvastatin shows the presence of singular one proton corresponds to a group (OH) at 9.56 (1H, s). The signals at 1.20 and 2.63 ppm attributable respectively to (H-21, H-22) due to the presence of oxygenated protons. A one proton singular signal (1H, s) resonating at 3.13 ppm attributable to the presence of methyl. the signals (H13a, H13b) (ddd, j2ab, j3ac, j3 ad, 1H) resonant at 1.76 (H15a, H15b) (ddd, j2ab, j3ac, j3ad, 1H) resonant at 1.65 ppm and (H17a, H17b) (dd, j2ab, j3ac, 1H) resonant at 2.63 ppm corespond to the presence of diastereoisotopic protons.
IV. Conclusion
In the present study, simple, rapid, sensitive, accurate, and precise spectrophotometric methods such as UV, infrared, and H1NMR for the determination of the stereochemical of atorvastatin in its pharmaceutical form were developed. In conclusion, the combination of UV, IR, and HNMR spectroscopic approaches enabled a full understanding of Atorvastatin’s stereochemical characteristics. These techniques have contributed to a better knowledge of its pharmacological properties and possible applications by providing significant information about its electronic structure, functional groups, and spatial arrangement of substituents.
Introduction
Hyperlipidemia is characterized by an unusually high level of lipids in the blood and is a major risk factor for a number of cardiac issues, including atherosclerosis and stroke. All etiologies are characterized by elevated levels of blood cholesterol, primarily low-density lipoprotein (LDL) and/or triglycerides. Statins are first-line treatments for hyperlipidemia [1, 2].
Statins bind to HMG-CoA reductase at nanomolecular quantities, causing dislocation of HMG-CoA, the natural substrate of this enzyme. There are currently seven statins on the market worldwide, all of which are deemed safe and well tolerated by the body, including Atorvastatin (Figure 01). The major function of atorvastatin is to reduce LDL cholesterol by inhibiting HMG-CoA reductase through a mevalonic acid-like moiety. As a result, inhibits a first and crucial rate-limiting step in cholesterol production in the liver [3, 4].
It is chemically defined as [R- (R*, R*)]. [(phenyl amino) carbonyl] -2-(4-fluorophenyl)-b, d-dihydroxy-5-(1-methylethyl) [(phenyl amino) carbonyl], Its chemical formula C33H35FN2O5 and is very barely soluble in distilled water, pH 7.4 phosphate buffer, and acetonitrile; it is slightly soluble in ethanol; and it is freely soluble in methanol [5, 6]. For the determination of atorvastatin in pharmaceutical form, in individual formulations and combined with other active ingredients, various analytical methods have been described, including spectrophotometric methods [7, 8]; notably: Vis-UVS spectrophotometry, INFRARD, H1NMR; Vis-UV spectroscopy is one of the methods of choice for the determination or quantification of a single component in pharmaceutical preparations. The reasons for this stem from the ease, their sensitivity and precision which most spectrophotometric measurements can be made [9,10].
Furthermore, determining the molecular structure may be greatly aided by IR spectroscopy. The IR spectrum of an organic substance is like a fingerprint; it can be used to identify a substance by comparison with previously recorded reference spectra or to demonstrate significant structural elements of the molecules with intense vibration bands [2, 3]
For chemical analysis, nuclear magnetic resonance (NMR) spectroscopy is a useful instrument. Because the spectrum displays distinctive peaks that correlate to the various types of hydrogen atoms in the compound, this provides important information on the chemical environment and structure of the molecule [10, 11].
the aim of this work is to determine the stereochemical of atorvastatin in its pharmaceutical form by using Spectrophotometric methods such as UV, FTIR, HNMR specifically to determine the diastereoisotopic protons.
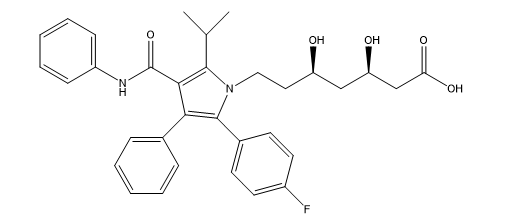
Figure 1: Chemical structure of Atorvastatin
II Experimental Method
The Vis-UV- spectrophotometry the preparation of sample solutions involved the powdering and precise weighing of 0,05 mg of Atorvastatin® 40 mg. The powder was dissolved in methanol to a volume of 20 ml. The device used in this work was of the “Specord 50 plus” brand. This new dual-beam UV/Vis photometer for the spectral range from 190 to 1100 nm combines high energy through put with best stability. we carried out a scanning in an interval going from 200 nm to 400 nm controlled by the software. and regarding the infrared method which is created and used as an identification method. A "Cary 630 FTIR " brand device was utilized with No sample preparation was necessary, with the exception of grinding for the FT-IR spectra to be acquired. The chirality of the atorvastatin molecule then leads us through a nuclear magnetic resonance (HNMR) spectroscopy to determine the diastereoisotopic protons by using the master Nova software
III. Results and Discussion:
UV-Vis spectroscopic analysis:
The specter of absorption visible UV of Atorvastatin in methanol present three characteristic bonds of absorption present in (Figure 02) and Table I.
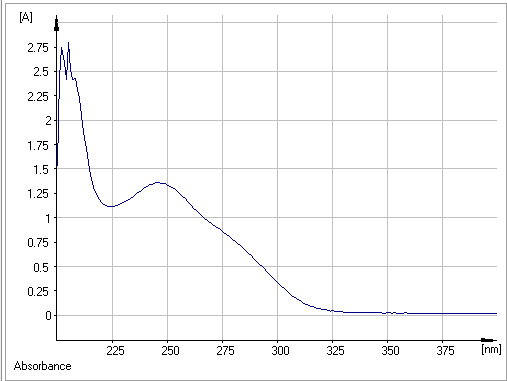
Figure 2: UV-absorbance spectra of Atorvastatin
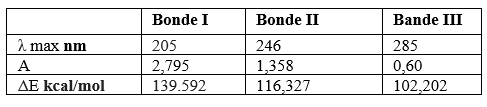
Table 1: Result of Vis-UV spectroscopic analysis of Atorvastatin
III.A.b. Discussion:
Using the Beer-Lamber absorption law, we can calculate the molecular extinction coefficients, which provide information on the intensities of the absorption bands.
- The first bond located at λmax =205 nm attributed to electronic transition п→п⁎ with an energy about Δ=139.592 kcal/mol and ε= 1118 which corresponds to the double aromatic links between both (C=C).
- The second bond situated at λmax = 246 nm attributed to electronic transition п→п⁎ with an energy about 116,327 Kcal/mol and ε= 543,2 which corresponds to the double links between both (C=O).
- The third bond situated at λmax= 285 nm with attributed to electronic transition n→п⁎ with an energy about 102,202 Kcal/mol and ε= 240 due to the presence of the free doublet of heteroatom (C=O, C -N).

Figure 3: Energy diagram of Atorvastatin
According to the Atorvastatin energy diagram (Figure 03), the electronic transition energy is inversely related to the wavelength, so as the transition energy decreases, the wavelength of the corresponding increases; this observation provides information on the molecule's stability based on the number of existing intramolecular interactions.
III.B.a. IR spectroscopic analysis:
An IR spectrometry was used to get the infrared absorption spectrum of atorvastatin. The spectrum is depicted in Figure 04, and a brief table 02 of peak assignments.

Figure 4: The infrared spectrum (IR) of Atorvastatin
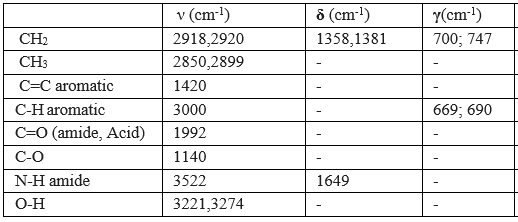
Table 2: Results of the infrared spectrum (IR)
III.B.b. Discussion:
- The infrared spectrum of atorvastatin presents 18 characteristic absorption bands;
- Four thin bands are located respectively at 2850; 2899; 2918; 2920 cm-1 correspond to the symmetric and asymmetric valence vibrations of the CH bonds of CH2 and CH3 (Table 02), this is confirmed by the presence of two absorption bands located around 1358; 1381 cm-1corresponds to the deformation vibrations in the same symmetrical and asymmetrical plane of the CH bonds of CH2 and CH3, and also by the presence of two fine absorption bands are located around 700; 747 cm-1 attributed to out-of-plane deformation vibrations of the CH and CH2 connections.
- A band located at 1420 cm corresponds to the vibration of the aromatic C=C bond, the aromacity is confirmed by the presence of two absorption bands around 669; 690, attributed to deformation vibration outside the aromatic C-H bond plane.
- A characteristic absorption band located at 1992 corresponds to the carbonyl bond valance vibration C=O.
- The amide function is characterized by the presence of a fine gap and intensity around 3522 cm attributed to the valance vibration of the N-H bond and this is confirmed by the presence of an absorption band located at 1649 cm due to the vibration of deformation in the same plane of N-H bonds and intensity band around 3522 cm attributed to the valance vibration.
- of the N-H bond and this is confirmed by the presence of an absorption band located at 1649 cm due to the vibration of deformation in the same plane of N-H bonds.
- Is The carboxylic acid function is characterized by the presence of a band located around 1140 cm corresponding to the vibration of the C-O bond valence, this is confirmed by the presence of a very wide band from 3500 to 2540 cm-1 corresponds to the vibration of the assigned valence at the O-H bond carbonyl acid.
III.C.a. HNMR spectroscopic analysis:
The determination of the structure of Atorvastatin, based on the H1NMR spectra, indicate the presence of 31 signals showed in Figure (05).
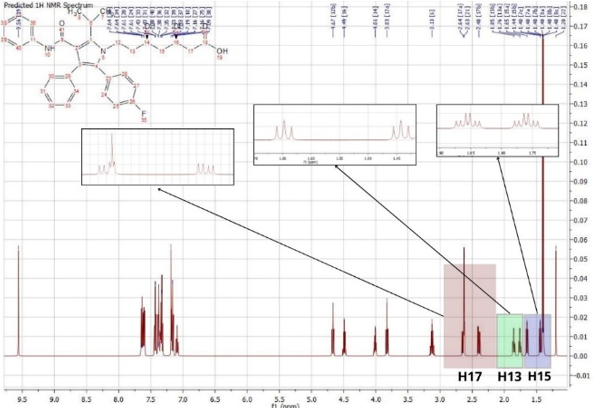
Figure 5: HNMR spectrum of Atorvastatin

Table 3: Chemical shifts in H1NMR and the attribution of Repaglinide signals
III.C.b. Discussion:
The H1NMR spectrum analysis of Atorvastatin shows the presence of singular one proton corresponds to a group (OH) at 9.56 (1H, s). The signals at 1.20 and 2.63 ppm attributable respectively to (H-21, H-22) due to the presence of oxygenated protons. A one proton singular signal (1H, s) resonating at 3.13 ppm attributable to the presence of methyl. the signals (H13a, H13b) (ddd, j2ab, j3ac, j3 ad, 1H) resonant at 1.76 (H15a, H15b) (ddd, j2ab, j3ac, j3ad, 1H) resonant at 1.65 ppm and (H17a, H17b) (dd, j2ab, j3ac, 1H) resonant at 2.63 ppm corespond to the presence of diastereoisotopic protons.
IV. Conclusion
In the present study, simple, rapid, sensitive, accurate, and precise spectrophotometric methods such as UV, infrared, and H1NMR for the determination of the stereochemical of atorvastatin in its pharmaceutical form were developed. In conclusion, the combination of UV, IR, and HNMR spectroscopic approaches enabled a full understanding of Atorvastatin’s stereochemical characteristics. These techniques have contributed to a better knowledge of its pharmacological properties and possible applications by providing significant information about its electronic structure, functional groups, and spatial arrangement of substituents.
References
- C. A. Pooja and P. Shailendra, “Chawla et al. (2019). Various analytical methods for analysis of atorvastatin: A review.
View at Publisher | View at Google Scholar - J. J. M. Nasr, N. H. Al-Shaalan, and S. M. Shalan, (2020). “Sustainable environment-friendly quantitative determination of three anti-hyperlipidemic statin drugs and ezetimibe in binary mixtures by first derivative Fourier transform infrared (FTIR) spectroscopy,” Spectrochim Acta A Mol Biomol Spectrosc.
View at Publisher | View at Google Scholar - S. Zsolt Farkas, S. Imre, D. Muntean, and A. Tero-vescan, (2013). “ANALYSIS OF DRUG RELATED IMPURITIES BY INFRARED SPECTROMETRY IN THE CLASS OF STATINS.
View at Publisher | View at Google Scholar - S. Ibesh, Y. Bitar, and S. Trefi, (2023). “A New method for simultaneous qualitative and quantitative determination of amlodipine besylate and atorvastatin calcium in bulk and pharmaceutical formulations using transmission FT-IR spectroscopy,” Heliyon.
View at Publisher | View at Google Scholar - A. A. Ramadan, H. Mandil, and J. Sabouni, (2015). “Determination of atorvastatin calcium in pure and its pharmaceutical formulations using iodine in acetonitrile by UV-visible spectrophotometric method DETERMINATION OF ATORVASTATIN CALCIUM IN PURE AND ITS PHARMACEUTICAL FORMULATIONS USING IODINE IN ACETONITRILE BY UV-VISIBLE SPECTROPHOTOMETRIC METHOD Original Article.
View at Publisher | View at Google Scholar - B. Yilmaz and S. Kaban. (2018). “UV and First Derivative Spectrophotometric Methods for the Estimation of Atorvastatin in Pharmaceutical Preparations.
View at Publisher | View at Google Scholar - S. Ashour, (2013). “New Kinetic Spectrophotometric Method for Determination of Atorvastatin in Pure and Pharmaceutical Dosage Forms,” Pharm Anal Acta.
View at Publisher | View at Google Scholar - S. K. Rath, S. V Samantaray, and S. C. Dinda (2013). “DEVELOPMENT AND VALIDATION OF NEW ANALYTICAL METHOD FOR THE ESTIMATION OF ATORVASTATIN CALCIUM HYDRATE RESIDUE BY USING UV SPECTROPHOTOMETER,” Int J Pharm Sci Res.
View at Publisher | View at Google Scholar - L. H. Nurani et al., (2023). “Review: Chemometrics-Assisted UV-Vis Spectrophotometry for Quality Control of Pharmaceuticals: A Review,” Indonesian Journal of Chemistry.
View at Publisher | View at Google Scholar - K. Addadi, K. Sekkoum, N. Belboukhari, A. Cheriti, and H. Y. Aboul-Enein, et al. (2015). “Screening approach for Chiral separation of β-aminoketones by HPLC on various polysaccharide-based Chiral stationary phases,” Chirality, vol. 27, no. 5, pp. 332–338.
View at Publisher | View at Google Scholar - L. F. Galiullina, G. S. Musabirova, I. A. Latfullin, A. V. Aganov, and V. V. Klochkov, et al. (2018). “Spatial structure of atorvastatin and its complex with model membrane in solution studied by NMR and theoretical calculations,” J Mol Struct, vol. 1167, pp. 69–77.
View at Publisher | View at Google Scholar
