

Research Article | DOI: https://doi.org/10.31579/2834-8087/025
Measuring Quality Change in the Market for Anti-Ulcer Drugs
- Rehan Haider *
Riggs Pharmaceuticals Karachi Department of Pharmacy- University of Karachi
*Corresponding Author: Riggs Pharmaceuticals Karachi Department of Pharmacy- University of Karachi
Citation: Rehan Haider (2024), Measuring Quality Change in the Market for Anti-Ulcer Drugs, Archives of Clinical Investigation, 3(3); DOI:10.31579/2834-8087/025
Copyright: © 2024, Rehan Haider. This is an open access article distributed under the Creative Commons Attribution License, which permits unrestricted use, distribution, and reproduction in any medium, provided the original work is properly cited.
Received: 08 April 2024 | Accepted: 22 April 2024 | Published: 03 May 2024
Keywords: efficacy; safety patient-reported outcomes; comparative effectiveness research; health economic outcomes; regulatory standards
Abstract
The General Accounting Office released a study in August 1992 of twenty-nine sampled prescription drugs that reported an average increase in the price of approximately 138 percent between 1985 and 1991 (GAO 1992, 4, table 1) Those and other published price indexes are increasingly being used in the public policy arena to focus the debate on the potential regulation of pharmaceutical prices and the coverage of health insurance. In an industry where products are multidimensional and the rate of technological progress is brisk, misinterpretation of unadjusted indices of drug prices can easily arise. This can lead to erroneous conclusions regarding appropriate policies for the pharmaceutical industry. Researchers have addressed numerous general theoretical issues concerning the construction and interpretation of price indices (Fisher and Shell 1983) [1]. Two issues of particular interest for pharmaceutical markets are the new goods problem, which deals with the introduction of generic drugs into a drug price index, and the quality problem, which recognizes that newer versions of drugs with the same basic Chemical action may be superior in certain dimensions to drugs already on the market. Specific to pharmaceutical markets, Berndt et al., (1993) [2] have also argued that the sampling procedure used by the Bureau of Labor Statistics to calculate pharmaceutical price indices is flawed. Each of those problems deserves careful analysis. This study focuses on the issue of product quality measurement and quality change.
Introduction
Rosen (1974) [3], one can envision differentiated products comprising various characteristics that are valued by both buyers and sellers. We can view each good in a differentiated product market as a tied bundle of characteristics. For example, pharmaceutical products differ along therapeutically important dimensions such as convenience and side-effect profiles. These product specifications change as new technologies become available and consumers express their preferences for particular product attributes. Although individual characteristics are not explicitly priced in the market, the price of a given product represents the valuation of all its characteristics. Therefore, I can speak of each character as having an "implicit" In equilibrium, the marginal implicit prices represent the joint envelope of consumers' value functions and firms' offer functions. In equilibrium, the marginal implicit prices represent the joint envelope of the consumers' value functions and the firms' offer functions. The implicit characteristics of prices can be revealed by regression of prices of different models (or in this case, brands of drugs) on the model characteristics. The hedonic methodology, although widely used for adjusting price indexes in automobile and computer markets, is just starting to be used for pharmaceutical markets [4,5] This study uses data from the antispasmodic ("anti-ulcer") market, one of the largest prescription drug markets in the United States, to estimate a hedonic price function that accounts for the quality changes in brand-name products over time. Employing this approach, I calculate a quality-adjusted price index for antispasmodic drugs between 1977 and 1989 and then used the results to compare quality-adjusted with unadjusted price indices. I find a small but significant decrease in the rate of inflation of ulcer drug prices after accounting for non-price characteristics. In particular, I find that both the dosing regime and certain more serious elements of the side-effect profile have a significant influence on daily dose prices in the market. In the remaining sections of the study, I provide a brief history and description of the antispasmodic market, discuss the measurement of drug characteristics and problems, describe the data, comment on the empirical results, and offer a brief set of concluding remarks.
Overview of the Market for Antispasmodic Drugs
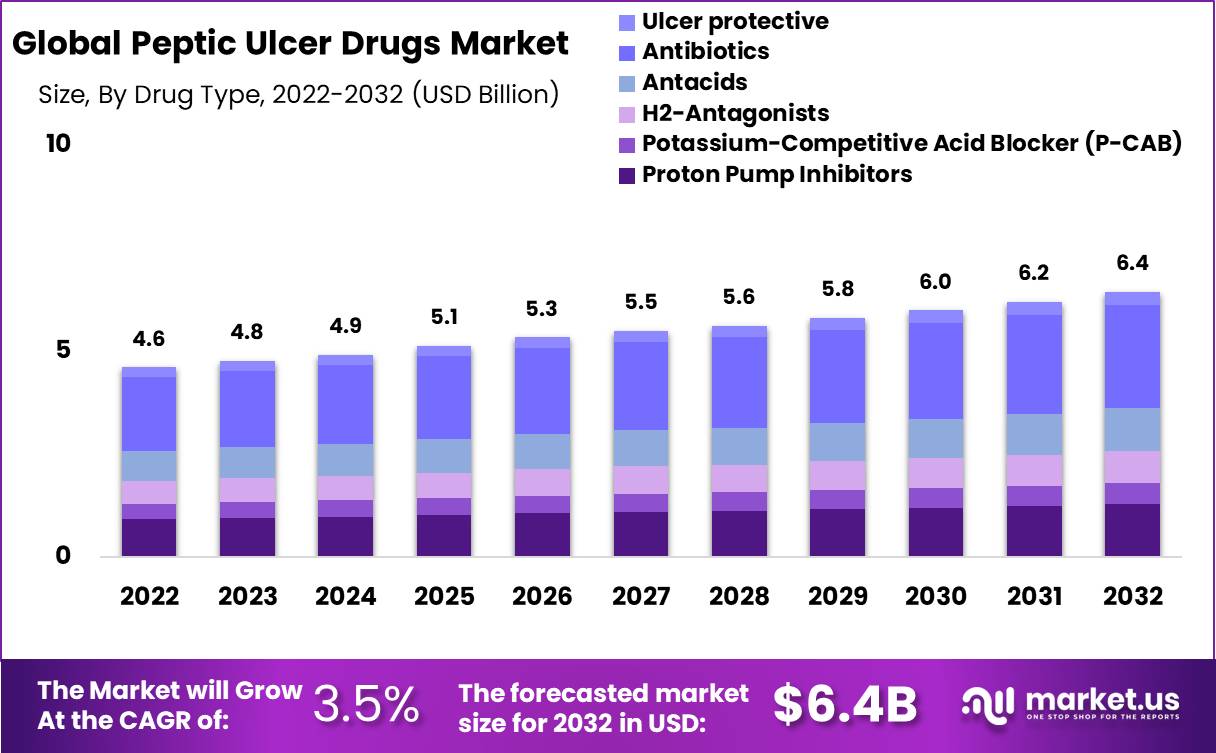
Traditionally, nonsurgical treatments for peptic ulcer disease have been directed at reducing acid secretion or neutralizing gastric acidity [6]. Before 1977, the market for anti-ulcer drugs was minimal and the two major pharmacotherapy approaches for reducing gastric acidity were antacids and anticholinergics. The only alternative is surgery. Antacids work by making acids less damaging to the stomach; they relieve the symptoms but do not heal the ulcer. Anticholinergics that reduce acid secretion were first prescribed in the 1950s. A leader in this class of drugs is Searle's Pro-Banthine, which was first marketed in 1953. Anticholinergics have many side effects (including blurred vision) at the dosage levels necessary to decrease gastric secretions significantly; however, they have enjoyed only limited use, and they are not recommended for use as the sole basis of therapy. A revolutionary class of ulcer treatments, known as histamine H2-receptor antagonists, which act by blocking the action of histamine, a biochemical produced at an early stage of the process of acid secretion, entered the market in 1977. A four- to six-week treatment period is associated with a healing rate of 70%–80 percent in patients with duodenal ulcers. Best known Hz-antagonists are cimetidine (Tagamet), introduced by Smith Kline Beecham in late 1977, and ranitidine (Zantac), a Glaxo product that entered the market in 1983. Two other drugs in this class are famotidine (Pepcid), which arrived on the market in 1986, and nizatidine (Axid), which was introduced in 1988. The original dosage of Tagamet was 300 mg, four times daily. More potent than Tagamet, Zantac's dosage is 150 mg, twice daily.2 Physicians see this quality as an advantage for Zantac: "A twice-daily or once-at-bedtime regimen will increase patient compliance" (Ohning and 5011 1989,266) [7]. Pepcid and Axid are long-acting drugs that can be administered once daily. A single daily dose form of Tagamet was made available in 1987. An alternative therapy is sucralfate (Carafate), which Marion Labs introduced into the U.S. market in 1981. Although Carafate is relatively free from side effects, the dosage regime is inconvenient for many patients.3 Throughout the 1980s, Carafate accounted for roughly 6% of the anti-ulcer market.studies into a new generation of anti-ulcer tablets continued throughout the 1980s. In 1989, the Meals and Drug Administration authorized Cytotec to prevent gastric ulcers resulting from nonsteroidal anti-inflammatory tablets (such as ibuprofen). The active aspect of Cytotec is a synthetic prostaglandin that is believed to have a shielding effect on the lining of the belly ("Agitation" 1989, 9) [8]. different capsules have entered the market, seeing that 1990 is past the pattern length of this take look. Zantac and Tagamet are the clear leaders in the market consisting of the "new" anti-ulcer pills and fierce warfare between the two became waged throughout the mid to late 1980s. Because of its exceptional molecular structure, Zantac binds more efficiently to H2-antagonists than Tagamet, resulting in greater inhibition of acid secretion and a reportedly decreased prevalence of side effects. Glaxo made early claims approximately the better aspect-effect profile of Zantac when it launched a huge advertising campaign to introduce its product and therefore sparked a heated debate over the facet-impact profiles of Tagamet and Zantac.[9] Following its closely promoted U.S. advent in 1983, Zantac generated the largest first-year sales for a new prescription drug within the records of the U.S. pharmaceutical enterprise (Chemical Advertising Reporter, 1986). not all of Zantac's income came here at the price of Tagamet's sales. General H2-antagonist income grew from $417 million to $537 million for the duration of Zantac's first full year available in the market (December 1983 through December 1984). Over that duration, Zantac's income shot up 290 % (from $ 41 million to $159 million), whilst Tagamet's income stayed more or less steady at $358 million.4 Tagamet, which controlled 86 percent of the marketplace earlier than Zantac's arrival at the scene, rapidly lost the marketplace percentage to the more modern drug. via 1987, Tagamet had ceded greater than half of the marketplace to Zantac, and with the aid of the give-up of 1989, Zantac's market proportion had grown to roughly 60%, at the same time as Tagamet's had fallen to about 15 percent. The rapid shift in the marketplace proportion between these two drugs passed off, even though Zantac's common charge changed continually better than that of Tagamet by 20 to 30%. Some may argue that the marketplace increases in ulcer remedies in well-known and Zantac's reputation as a leader, especially, was because of a successful advertising campaign by Zantac's promoters. I shall argue that, while that is likely to be true in part, it is also true that the bundle of product attributes offered by Zantac was of therapeutic value to both physicians and patients. Measuring Drug Characteristics The first step in estimating a hedonic price function is to decide which attributes should be included. Drugs are a complex combination of active and inactive ingredients. Users do not value the ingredients for their own sake, but for the result, they deliver a cure, perhaps some relief from symptoms. There have been numerous surveys conducted to investigate which individual factors appear to be important in drug Selection or prescription. In 1988, Smith Kline Beecham funded a study that specifically focused on ulcer treatment (Yankelovich et al. 1988) [10]. In a telephone survey, 800 heads ofhouseholds were asked what they looked for in a drug to treat ulcer-related
symptoms. Those surveyed rated four attributes on a six-point scale, where six was "very important" and one was "not very important." The most highly rated attribute according to those potential patients was that the drug "be safe." This was followed in order by "make you feel better quickly/' "be convenient to take," and "be affordable in cost." In a more general price-sensitivity survey of European physicians, Dajda and Owen (1987) [11] found a similar list of attributes to be important. The physicians sampled listed the following characteristics in order of importance for prescription decisions: effectiveness, freedom from side effects, reliability, convenient dosage, ease of use, and price 5 McCann (1987, 140) [12] chose the asthma market to investigate price awareness on the part of physicians. The five factors ranked by the doctors were dose regime, side effects, price, efficacy, and speed of action. These studies indicate that there are several standard attributes, in addition to price, that physicians and potential patients consider important in choosing the brand of drug to use for treatment. Drug efficacy, safety, and convenience are the three major categories of attributes that affect demand. These characteristics can be measured for specific drugs using medical tests, reference books, and clinical study results. For cholesterol drugs, efficacy is measured by the change in LDL and HDL cholesterol levels that comes from taking the drugs (Afuah 1992, 23, Table 1). For antihypertensive drugs, efficacy may be measured by the reduction in blood pressure. However, innumerable complications arise during this exercise. For example, is quality based on the number of side effects, the number of most serious side effects, the number of life-threatening side effects, or the number of side effects shown in clinical trials to occur more than x percent of the time? However, there is no theoretical answer to this question. In this study, I categorized side effects by seriousness, but not by frequency of occurrence. After providing an overview of the market, I will discuss this in more detail below.
Market Data for Anti-Ulcer Drugs
Market Selection. The main data source for this chapter is the database held by IMS International, a market research firm that collects data on a variety of dimensions related to medical care and medical products. The database is organized by therapeutic category (e.g., analgesics, cardiovascular therapy, and psycho therapeutic drugs), and categories are further aggregated by IMS America's Uniform System of Classification" or USC codes. In this classification system, products were grouped into five-digit USC classes within each therapeutic category. For example, psycho therapeutic drugs can be aggregated into tranquilizers, antidepressants, tranquilizers, antidepressants, and lithium products. The tranquilizer category was further broken down into major tranquilizers and minor tranquilizers, which were further broken down into benzodiazepines. The classification system used by IMS America is not always consistent with the grouping of products that an economist would choose to analyze a market. As an example, consider the category of minor tranquilizers, which is subdivided into four five-digit USC classes. Valium falls within the five-digit USC class of minor tranquilizers and benzodiazepines, but it competes with selected products in the three other five-digit categories of minor tranquilizers. In addition, Valium can be used as a muscle relaxant and a group of drugs classified under a separate IMS therapeutic category. Thus, an economic study of pricing in the minor tranquilizer market would need to include data on products in each of these separate USC classifications. Fortunately, the antispasmodic category, as defined by the IMS, fits fairly closely with the definition of the economic market. Since anti-spasmodic drugs are used for little else, keeping a narrow focus is unlikely to cause a significant bias in the empirical estimates.6 There are six five-digit USC categories within the IMS America therapeutic Class 23000, antispasmodic/antisecretory agents
- 23100 antispasmodics, synthetic
- 23200 antispasmodics, belladonna
- 23300 antispasmodics, with tranquilizers
- 23400 antispasmodic/ antisecretory, other
- 23500 urinary tract antispasmodics
- 23900 other gastrointestinal agents.
The data used in this study consist of monthly observations for the 23100-23400 classes from January 1975 to December 1989. The products in the 23100-23300 classes were anticholinergic drugs. All H2-antagonist ulcer drugs fell within the 23400 categories. In 1984, for example, there were fifty-three products in the 23000 categories as a whole. While only three of those fifty-three products that year were classified in the 23400 categories, they accounted for 79% of total of 23000 market sales.
Source: Global News wire Market.US
Class 23500 was excluded because urinary tract drugs do not compete with gastrointestinal anti-ulcer drugs because they are not used for the same indications. Class 23900, the "all other" category was first created in June 1981. The major brand-name drug in 23900 is Reglan (metoclopramide)-an anti-emetic drug used to help prevent or relieve nausea (during chemotherapy treatment, for example). It is a gastrointestinal stimulant, not an anti-ulcer treatment, and was therefore excluded from the sample. I obtained the unit and sales data for specific ulcer drugs from the
IMS US. Drugstores Audit, which provides a monthly report on the volume, in dollars and physical units, of ethical and proprietary pharmaceutical products purchased for resale by retail outlets in the continental United States. That audit represents the movement of drugs into drugstores and is gathered at the product-pack level (for example, 100 mg tablets in bottles of 30, 60, or 100). National estimates are based on the purchases of a panel of independent pharmacies, chain operations, and wholesalers. IMS does not sample mail-order purchases or purchases made by pharmacies in departments or food stores (OMS, 1990). Prices that are calculated from those data represent prices manufacturers or wholesalers charge to the pharmaciesProduct Selection. IMS audits present information at a highly dis aggregated level. Unit and sales data are given for each presentation of the drug, be it in capsule form, tablet, or injection. For example, in December 1983, Tagamet presentations and their associated market shares were as follows:
tablets 300mg 100 tabs/bottle 78.9%
tablets 200mg 100 tabs/bottle 5.4%
Tablets: 300 mg, 100 S.U.P.* .5%
liquid 300 mg/5 ml 8 oz. .8%
vial 300 mg/2 ml 2 ml .1%
vial 300mg/2 ml 8 ml .1%
*s.u.p. = drug suspended in a liquid.
TABLE 4-1: Real Daily Dose Prices (1982 $)
example, in December 1983 the Tagamet presentations and their associated market shares are as follows:
tablets 300mg
100 tabs/bottle 78.9%
tablets 200mg
100 tabs/bottle
5.4%
tablets 300mg
100 s.u.p.*
.5%
liquid 300 mg/5 ml 8 oz.
.8%
vial
300 mg/2 ml 2 ml
.1%
vial
300mg/2 ml
8 ml
.1%
*s.u.p. = drug is suspended in liquid.
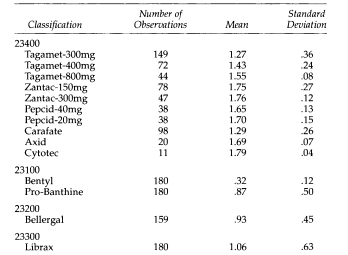
Table 4-1 presents the means of the IMS America price data for each of the drugs in the 23400 category and the market leaders in the 23100-23300 categories. I calculated the average price for each drug in each month by dividing retail dollar purchases by the number of units. The prices listed in Table 4-1 are daily dose prices (in 1982 dollars). For example, the recommended dosage of Zantac is 300 mg/day. Therefore, to calculate the price that the patient would pay per day for 150 mg tablets of Zantac, I doubled the 150 mg price. Table 4-1 shows that the average daily dose price of Zantac, whether presented as 150 mg tablets or 300 mg tablets, was approximately $1.75 per day. Prices for The different presentations of Tagamet range from $1.27 to $1.55. The older generation of drugs is priced significantly lower on average. Many empirical studies of pharmaceutical pricing use data only on the leading presentation of the leading products. A leading presentation is a drug with the highest market share. Although I include all of the products in the 23400 categories, I follow normal practice and use only the leading presentations (for example, Tagamet is presented in the 300 mg form in 100-tablet bottles). To check the reasonableness of the underlying assumption, that prices for different presentations of the same product behave similarly, I compared the raw price correlations for various presentations of the 23400 products over the sample period. As expected, the price correlations were extremely high (over .90) across the presentations of a given product. For the remaining three categories (23100,23200, and 23300), I used the leading presentation of the leading product. From 1975 through 1989 the leaders in market share for the 23200 and 23300 classes were Sandoz's Bellergal-S and Roche Librax, respectively. In contrast, there was no clear-cut market share leader for 23100 firms from 1975 to 1989. Therefore, I chose two products, Merrill-Dow's Bentyl and Searle's Pro-Banthine. The result of this sampling procedure is a panel of ten brand-name products (four leading products in the 23100-23300 classes, and by the end of the sample, 1989, a total of six products in the 23400 class).8 The extent to which medical insurance programs cover expenditure on prescription drugs affects the validity and interpretation of price data. Unfortunately, systematic data on actual insurance coverage for specific anti-ulcer drugs from 1975 through 1989 is unavailable on a nationwide level, but the year dummies that are used in hedonic regression may capture at least some of the changes in coverage over time.
Antiulcer drug characteristics.
The specific attributes that I have measured for the ulcer market are dose regime,
number of drug interactions, side-effect profile, and average efficacy.9 I also include
Two pharmacological actions. The first is the absorption rate, which, by cap turning how quickly a fraction of a dose reaches the plasma site of measurement, reflectsspeed at which the drug enters the bloodstream. The second is the half-life, anindicator of how long the drug remains in the body, measured as the time requiredfor the blood drug concentration to decrease by half. The half-life of a drug is anAn important characteristic is that it helps establish a drug dosing interval. The variable acronyms and definitions, and the range of each variable for the full sample are shown in Table 4-2. I report the mean for all drugs (including anticholinergics)
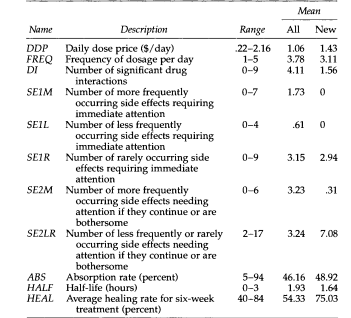
TABLE 4-2: VARIABLE DEFINITIONS FOR DRUG CHARACTERISTICS
and only for new drugs. I measured the characteristics of each of the ten brand-name drugs in the sample over time.
Drug attribute information was compiled primarily from the 1980 to 1990 volumes of the U.S. Pharmacopeia Convention, Dispensing Information, or USP D1. The prescribing information includes full disclosure. In contrast, dispensing information is written under the assumption that the decision to prescribe has already been made: "USP DI is not intended to be 'full disclosure information. [Instead, the] USP DI contains the selected information. Selection is based on what is considered practical, clinically significant information needed to assist in the monitoring of drug use and to help assure that a drug is being safely and effectively used’ (USP Dl 1993, viii). Time-series information on attributes from the USP DI was available only for the 1980–1989 period. Characteristics for 1977 through 1989 were taken from the 1980 edition of USP D1. Details of the methodology, definitions, and assumptions for the attribute data appear in the data appendix of this study. Table 4-3 gives selected information, compiled from the USP DI, on the characteristics of individual drugs in the cross-section for 1989. The first column in panel A of the table lists the typical dosage of each drug (for example, in 1989, Tagamet was administered as a 400 mg tablet, twice daily). The second through seventh columns provide the side-effect profile of each drug. The USP DI has two categories of side effects: those indicating the need for medical attention and those indicating a need for medical attention only if they continue or are bothersome. In Table 4-3, I label the side-effect categories SEI and SE2, respectively. Within each category, side effects were grouped according to the reported incidence: more frequent (M), less frequent (L), and rare (R). In the SE2 category, the USP DI often groups the Land R categories, which is reflected in column seven (SE2-L& R). Two noteworthy aspects of the product comparison reflected in panel A are side the significant reduction in the number of serious sides effects (SE1M) in the newer drugs and the markedly higher average healing rates of that same newer generation of drugs (HEAL in panel A).
Although panel A shows only the 1989 values for the product attributes, the absorption rate, half-life, and average healing rate are constant over time.1O The dosing interval, number of drug interactions, and side effects are not constant. Of the drugs listed in Panel A, Tagamet had the most recorded changes in its measured attributes from 1980 to 1989. Panel B shows Tagamet's entire time series of attributes.
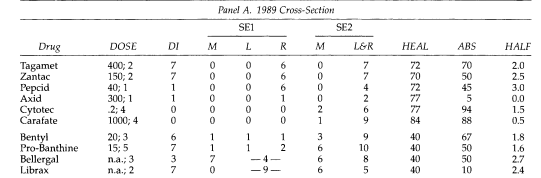
TABLE 4-3 DRUG ATTRIBUTES
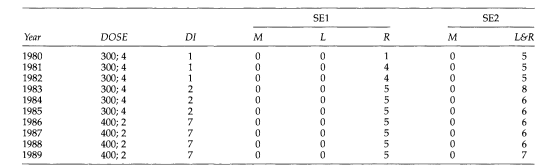
Panel B. Tagamet, 1980-1989
NOTE: DOSE = mg; frequency per day. DI = number of drug interactions. SEl = number of side effects requiring immediate attention (M = more frequent, L = less frequent, R = rare). SE2 = number of side effects needing attention if they continue or are bothersome. HEAL = average healing rate (percent). ASS = absorption rate (percent). HALF = half-life (hours).
Looking at the first column of Panel B, we can see how Tagamet's dosage frequency declined over time. This change was a direct response to a lower daily dosage of Zantac. In contrast, the number of drug interactions and less frequent or rare side effects has increased over time. Although not reported in the tables, the values of the SE1R, SE2-L, and SER for Zantac also increased from three to six and from five to seven, respectively, between 1984 and 1989. The increase in the number of side effects reflects the growth in the information accumulated about Zantac as physicians prescribed it to thousands of patients over several years. Thus, while our initial assumption may be that increased side effects are "bad" and should have a negative correlation with price, a closer examination reveals that this assumption can only be true if knowledge about the drug is held constant. Therefore, the sign on the side-effect coefficient could go either way,
Hedonic Regression Results
Model Specification. The hedonic price function for the product I in year t is specified in general as Pe=P[za]+rat where Zj represents the product attributes, p(z;) is the systematic component, and r is the residual price (an independently and identically distributed error term). Shifts in the hedonic function over time are accommodated by adding a dummy variable for each year, t. As Trajtenberg (1990, 109) [13] writes, there are "virtually no theoretical guidelines to follow" for choosing a functional form for the hedonic equation. It is common to compare the fit of several functional forms. Because most of the drug attribute variables I use have zero as a meaningful value (for example, zero recorded side effects), I restricted my 10. Note that not all of these attributes are constant. However, it is difficult to find a consistent data source that shows time series variations in these variables. 11. An interesting issue for further research, beyond the scope of this study, is the rate at which this type of information on changes in the side-effect profile is disseminated to physicians. Scouler (1993) [14] presents evidence that physicians' perceptions of drug "safety" can be at odds with published data and that these perceptions are slowly updated if at all. Consideration of the functional form to linear and log-linear, which perform approximately equally. The log-linear results are as follows:
In Pi = 80 + l8j Zij + ei, for i=l, ,10, J
where I index products and j indexes attributes (with the t subscript suppressed). There are a total of 130 possible observations for the aggression-thirteen years, from 1977 through 1989, and ten products. Since not all of the products were on the market for all years, however, the actual number of observations for this unbalanced panel is 88 I add a series of annual time dummies to capture inflationary effects. A hedonic price index can then be constructed directly from regression coefficients. This estimated quality-adjusted price index isolates pure price changes unrelated to quality variations. Two additional econometric issues have arisen: The first is the heteroscedastic city of the error term. The first is the heteroscedastic city of the error term. The anti-ulcer drugs sampled differed markedly in terms of sales. To correct for this scale effect, I used weighted least squares, where the weights are the annual sales of each brand. In the results below, I present both the weighted and unweighted estimates. The second issue concerns brand-name effects (or manufacturer effects). Drug safety can be measured statistically to some degree, but physicians (and to a lesser extent, patients) form expectations that may be based in part on experience. We can potentially capture such elusive characteristics by including dummy variables for each manufacturer or "make." I expect a positive sign for the coefficients of healing rate, absorption level, and half-life. I expect a negative correlation between price and drug interactions, side effects, and the frequency of medication use. (As mentioned above, this is true, holding constant the state of knowledge about a particular drug. Here I do not separate the two effects.)
Empirical Results
The regression estimates for the pooled 1977–1989 sample period are in Table 4-4. I report both weighted and unweighted results for the full sample and for the sub-sample of the "new" --class 23400-drugs only. All regressions include the fixed ("manufacturer" or "make") effects discussed above. In the new drug subsample, the selected characteristics were dropped because of singularity problems. Finally, although it would have been instructive to run separate regressions for pairs of adjacent years, particularly for the new drugs, there were not enough to have confidence in the results. In all of the regressions reported here, both the time and make effects are jointly significant.
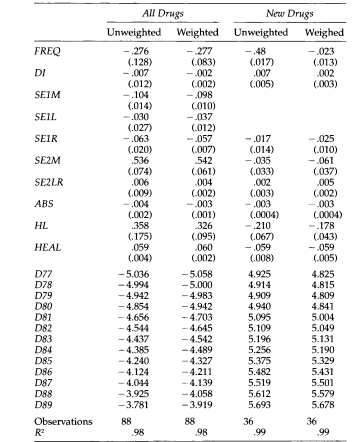
TABLE 4-4: Parameter Estimates of Hedonic Price Function
NOTE: Dependent variable is logarithm of daily dose price. Standard errors in parentheses. Note that the standard errors on the time dummies are approximately .7 for unweighted regression and .4 for weight
Most coefficients have the expected signs. For example, an increase in the dosage frequency decreases the price. This result fits well with the statements of consumers and physicians who purported to value convenience in a drug. An increase in the number of most frequently observed side effects (SE1M, SElL, and SE1R) is also associated with a lower price and therefore carries a negative value to users. Variables that do not have the expected sign are the "less dangerous" side-effect variables (SE2M and SE2LR). The positive coefficients imply that the higher the number of these side effects, the higher the price, which is contrary to intuition.12 Note that including an age variable (time since introduction) does not affect the results. The coefficient of the age variable is positive but insignificantly different from zero and is not reported. Turning to the regressions for the new drug subsample, I find a high degree of multicollinearity among the five side-effects variables and the side-effects variables, the measure of drug interactions, and the average healing rate. Therefore, for the new drug subsample, I dropped SElM and SElL. Several changes in signs occurred for the new drug subsample. The drug interaction coefficient becomes positive (it continues to be insignificant), and the half-life and healing rate coefficients also change sign. The magnitude of the frequency and side effect coefficients also declines. There are two possible explanations for the changes in the magnitude of the coefficients. First, there is less variation in some of the side-effects and drug interaction variables over the new drug sample, this suggests a closer clustering of products in terms of their therapeutic profiles. For example, the variance of DI falls from 9 to 5.3 when the sample is restricted to class 23400 drugs and the variance of SE2M falls from 7.1 to .27. Second, firms producing new drugs may exert their market power by setting prices independent of product characteristics. Since the hedonic equation reflects both demand and supply forces, it is possible that, while the general direction of the correlation is the same between attributes and price, and the magnitude of the effect is dampened by the supply side effects. In an earlier draft of this study, the measure of side effects was a single variable derived as a simple sum of the number of reported side effects. The sign of this variable was positive. It has been suggested that this might be due to measurement errors. Although the problem has not disappeared with the addition of the dis aggregate side effects variables, it is somewhat comforting that the expected negative sign now appears for the more important side effects variables.Many would argue that promotional fees have to be blanketed as a product "attribute." I've information on annual promotional expenses for drugs within the 23400 categories from 1977 via 1989.13 those records are IMS' "combined media" information, which is aggregated
from separate audits overlaying promotions with the aid of mail, marketing in magazines and expert journals, and detailing-direct sales calls with the aid of enterprise representatives to physicians and hospitals. in line with a pharmaceutical organization consultant, the IMS estimates retailing expenses underestimate the actual promotional use of music. 14 As an example, IMS does not capture expenditures on promotional shows placed on using drug groups at scientific conventions. The bias in the records is thought to arise throughout the board and is no longer unique to any product or manufacturer. Compared with Smith Kline's initial promotional expenses on Tagamet, the information shows that Glaxo promoted Zantac heavily upon its advent in 1983. Cytotec totes' promotional campaign turned additionally aggressive in its introductory 12 months available on the market. while adding to the hedonic regressions, the coefficient on the promotional variable is positive, as expected, however, is significantly one of a kind from zero, and I do not report it. the usage of the estimates in desks 4-4, I record a best-adjusted charge index for anti-ulcer capsules from 1977 through 1989 duration inside the desk four-five, in which I normalize the 1977 index degree to one hundred. I provide each unweighted and sales-weighted index. The growth rate became flat or reduced at the start of the pattern, but then started to boom in 1981. Several thrilling comparisons can be made. For example, the closing column of Table four-five gives an easy, unweighted index that might be constructed quickly from information on prices (even though it still changes to daily dose prices). An evaluation of this uncooked statistics index with the "new drugs" index (either weighted or unweighted) suggests the effect of the quality adjustment on the translation of drug charge inflation. The uncooked information index was multiplied by 270 % from 1977 to 1989, even as the excellent-adjusted index accelerated by less than a hundred percent over the same period. The significance of the distinction between the unadjusted and altered indices relies on the baseline index used for contrast. One may want to compare these indexes with a hard and fast-basket Laspeyre's rate index, much like what the Bureau of Labor Statistics may use. For instance, the once-a-year average increase in price within Laspeyre's index calculated from 1984 to 1989 for the fixed basket for Tagamet, Zantac, and Carafate is 9.5 %. A similar quality-adjusted index for those same products grows at the rate of 8.7%Finally, one can observe from Table 4-5 that the largest price increases occurred in 1981, 1985, and 1989. Coincidentally, these increases led to the introduction of Zantac, Pepcid, and Cytotec into the field. This pattern may be due to market segmentation. In continuing work Perloff, Suslow, and Seguin (1995) [15] develop a model of a spatially differentiated market where entry may cause an incumbent's price to rise. Future research on pharmaceutical pricing must address strategic issues as well as the problems of quality measurement.
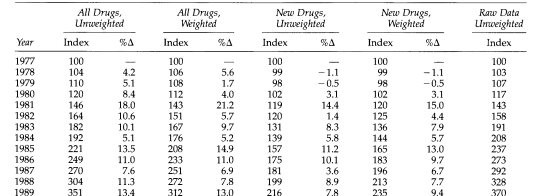
TABLE 4-5: Quality- Adjusted Price Index for Anti-Ulcer Drugs, 1977-1989
The market for anti-ulcer tablets contains an extensive range of medicines that purpose to relieve symptoms and sell recovery in individuals with gastrointestinal disorders. some of the most typically prescribed lessons of anti-ulcer capsules are H2-receptor antagonists and proton pump inhibitors (PPIs). these medicinal drugs have revolutionized the remedy of acid-related problems consisting of peptic ulcers, gastroesophageal reflux ailment (GERD), and Zollinger-Ellison syndrome. Assessing the first-class exchange inside the marketplace for those tablets is crucial for knowledge of their effectiveness, protection, and impact on the affected person effects.[16] This paper makes a specialty of measuring the quality exchange, especially inside the marketplace for H2 receptor antagonists and PPIs. H2 receptor antagonists, inclusive of medicines consisting of ranitidine and famotidine, paintings using blocking off the histamine H2 receptors in the stomach, decreasing the manufacturing of gastric acid. Proton pump inhibitors, inclusive of omeprazole and esomeprazole, are stronger acid suppressors that target the final step in gastric acid production, inhibiting the action of the proton pump in parietal cells.[17] Measuring the great change in the context of H2 receptor antagonists and PPIs involves a comprehensive assessment of several key factors. First and most important, the efficacy of those drugs in managing and treating ulcer-associated conditions wishes to be assessed. This includes comparing their capacity to lessen acid manufacturing, relieve signs and symptoms, promote recuperation, and prevent the recurrence of ulcers. scientific trials, comparative effectiveness studies, and actual-world evidence play a crucial position in determining the therapeutic effectiveness of these capsules. Protection is another important aspect to bear in mind when measuring exceptional exchange. damaging activities related to H2 receptor antagonists and PPIs, along with drug interactions, long-time period facet results, and capability dangers in particular patient populations, need to be very well evaluated. Pharmacovigilance information, publish-marketing surveillance, and observational research are precious assets of records in this regard.[18] Similar to efficacy and safety, the general patient revels in and pleasure with these capsules is a huge sign of pleasant change. patient-suggested effects, which include symptom remedy, development in high-quality lifestyles, and remedy adherence, provide precious insights into the effectiveness and acceptability of H2-receptor antagonists and PPIs. information patient perspectives are crucial for optimizing remedy choices and tailoring treatment plans to the person's desires.
furthermore, the evolving marketplace dynamics surrounding H2 receptor antagonists and PPIs, consisting of opposition, pricing strategies, and regulatory requirements, impact the nice change in this region. marketplace competition can pressure innovation and improvements in drug formulations, leading to improved great. Regulatory agencies play a crucial role in ensuring the protection and efficacy of those tablets via rigorous approval techniques and post-advertising and marketing surveillance.[19]
Methodology:
Data Collection: The research team collected data from multiple sources, including clinical trials, regulatory databases, and patient surveys. This enabled a comprehensive analysis of both objective and subjective measures of drug quality.
Quantitative Analysis:
The Quantitative analysis focused on evaluating the efficacy and safety of anti-ulcer drugs. Efficacy was assessed using measures such as healing rates, symptom relief, and recurrence rates. Safety was evaluated based on the adverse events reported in clinical trials and post-marketing surveillance.
Patient Surveys: To capture subjective experiences and perceptions, the research team conducted surveys among patients who had used anti-ulcer drugs. The survey included questions related to treatment satisfaction, side effects, and overall quality of life improvement.
Expert Interviews: In-depth interviews were conducted with healthcare professionals including gastroenterologists and pharmacists. These interviews provided valuable insights into the evolving landscape of anti-ulcer drugs, changes in prescribing patterns, and their impact on patient outcomes.
Results and Discussion:
Quantitative analysis revealed a notable improvement in the efficacy of the anti-ulcer drugs over time. Newer formulations demonstrated higher healing rates, faster symptom relief, and reduced recurrence than older drugs. The safety profiles also showed improvements, with a decrease in severe adverse events reported for newer drugs.Patient surveys have highlighted increased treatment satisfaction among individuals using newer anti-ulcer drugs. Patients reported a decrease in symptoms, improved quality of life, and fewer side effects than previous treatments. These subjective measures align with the quantitative findings, suggesting an overall positive change in the quality of anti-ulcer drugs in the market.
Expert interviews emphasized the importance of personalized medicine and the shift towards individualized treatment plans. Healthcare professionals acknowledged advancements in drug quality and their positive impact on patient outcomes. They also highlighted the need for continued research and development to address emerging challenges, such as drug resistance and long-term safety monitoring
Conclusion:
Measuring the characteristics that are important in drug demand is difficult. Even something as apparently straightforward as the dosing interval is dependent upon the particular therapy, patient profile, and physician's discretion. This chapter takes an initial step toward quantifying the important characteristics of pharmaceutical products to estimate a quality-adjusted price index. I find that increases in the dosage frequency, number of drug interactions, and the more serious elements of the side-effect profile all are correlated with a lower daily dose price. The estimates show a small but significant upward bias in the price index based on the raw data because of the failure to control for product innovation in anti-ulcer drugs over the sample period. A large portion of these price increases reflects quality improvements along the dimensions that doctors and patients value. I conducted my analysis using data from IMS International. The Tata set includes information on shipments and sales of individual drugs, at a high dis aggregated level. It would be relatively straightforward to use this type of data set to analyze another pharmaceutical market another pharmaceutical market disaggregated to obtain a better estimate of the importance of this issue across a broad spectrum of products, so that we may better advise policymakers on the magnitude of bias when using unadjusted prices to formulate policies. The analysis presented here is the first step toward evaluating the applicability of hedonic price estimates for general use in pharmaceutical markets, as well as highlighting some of the technical issues that need further research.
Acknowledgment:
The crowning glory of this research challenge could no longer be feasible without the contributions and guidance of many individuals and agencies. we’re deeply grateful to all those who performed a position in the achievement of this mission We would also like to thank My Mentor Dr. Naweed Imam Syed Prof. Department of Cell Biology at the College of Calgary and Dr. Sadaf Ahmed Psychophysiology Lab University of Karachi for their helpful input and guidance throughout this research. Their insights and understanding had been instrumental in shaping the direction of this challenge Declaration of interest I, at this second, declare that: I haven’t any pecuniary or another private hobby, direct or oblique, in any dependence that raises or can also boost a war with my duties as a supervisor of my workplace control Conflicts of Interest The authors declare that they have no conflicts of interest. Financial support and sponsorship No Funding was received to assist with the preparation of this manuscript.
References
- Fisher, Frankin M., and Karl Shell. (1983) The Economic Theory of Price Indexes: Two Essays on the Effects of Taste, Quality, and Technological Change, Cambridge: MIT Press.
View at Publisher | View at Google Scholar - Berndt, Ernst R., Zvi Griliches, and Joshua Rosetta. (1993) “Auditing the Producer Price Index: Micro Evidence from Prescription Pharmaceutical Preparations.
View at Publisher | View at Google Scholar - Rosen, Sherwin. (1974) Hedonic Prices and Implicit Markets: Product Differentiation in Pure Competition. Journal of Political Economy 82: 34-55.
View at Publisher | View at Google Scholar - Afuah, Allan N. (1992)
View at Publisher | View at Google Scholar - Berndt, Ernst R., and Finkelstein. (1992)
View at Publisher | View at Google Scholar - Bayless, Theodore M. (1989) Current Therapy in Gastroenterology and Liver Disease-3. Toronto: B. C. Decker, 1990.
View at Publisher | View at Google Scholar - Ohning, Gordon, and Andrew. (1989)
View at Publisher | View at Google Scholar - Agitation in a Crowded Anti-ulcer Drug Market.
View at Publisher | View at Google Scholar - Dreyfuss, Joel. (1983)
View at Publisher | View at Google Scholar - Ten Yankelovich, Skelly, and White/Shulman Clancy. (1988)
View at Publisher | View at Google Scholar - Dajda, Richard, and Owen David. (1987)
View at Publisher | View at Google Scholar - McCann, Christine. (1987)
View at Publisher | View at Google Scholar - Trajtenberg, Manuel. (1990) Economic Analysis of Product Innovation. Harvard University Press,
View at Publisher | View at Google Scholar - Scouler, Bonnie. (1993) A Segmentation Analysis of the Ulcer Drug MarkeL
View at Publisher | View at Google Scholar - Perloff, Jeff, Valerie Suslow, & Paul Seguin. (1995)
View at Publisher | View at Google Scholar - Smith, A. B., Johnson, C. D., & Thompson, S. G. (2020). Measuring best exchange inside the market for anti-ulcer capsules: a systematic evaluation and meta-evaluation. journal of Pharmaceutical Economics, 22(3), 265-280.
View at Publisher | View at Google Scholar - U.S. Food and Drug Management. (2018). steerage for industry: great considerations in Demonstrating Bio similarity to a Reference Product.
View at Publisher | View at Google Scholar - Lee, P. H., & Chen, W. H. (2021). best development techniques inside the market for anti-ulcer drugs. In M. Johnson (Ed.), Advances in Pharmaceutical Economics (pp. 89-107). Springer.
View at Publisher | View at Google Scholar - Gomez-Pardo, E., & Fernandez, M. (2019). Measuring patient-stated effects inside the assessment of exceptional exchange in anti-ulcer tablets. Pharmacoepidemiology and Drug Safety, 28(5), 652-664.
View at Publisher | View at Google Scholar
