

Research Article | DOI: https://doi.org/10.31579/2834-796X/068
Early impaired relaxation of the left ventricle in isolated, uncomplicated prehypertension without left ventricular hypertrophy can be detected by exercise electrocardiography
*Corresponding Author: S.R. Mittal, Department of Cardiology JLN medical college, Ajmer (Rajasthan),India.
Citation: S.R. Mittal, Govind Mittal, (2024), Early impaired relaxation of the left ventricle in isolated, uncomplicated prehypertension without left ventricular hypertrophy can be detected by exercise electrocardiography, International Journal of Cardiovascular Medicine, 3(4); DOI:10.31579/2834-796X/068
Copyright: © 2024, S.R. Mittal. This is an open access article distributed under the Creative Commons Attribution License, which permits unrestricted use, distribution, and reproduction in any medium, provided the original work is properly cited.
Received: 10 June 2024 | Accepted: 26 June 2024 | Published: 03 July 2024
Keywords: diastolic dysfunction; electrocardiography; exercise electrocardiography; left ventricle; lead v1; p wave; treadmill testing
Abstract
Nearly fifty percent of patients with isolated, uncomplicated prehypertension have impaired relaxation of the left ventricle even in the absences of left ventricular hypertrophy. Such early impairment of the left ventricular relaxation can be detected by exercise electrocardiography. Transient increase, in the area of the negative terminal deflection of the P wave in lead V1 (>0.04mVaec) during and/or early recovery suggested transient increase in the left atrial pressure due to unmasking of the early impairment of the left ventricular relaxation by exercise induced tachycardia.
Introduction
Prehypertension is defined as systolic blood pressure of 120 to 139 mm Hg and/or diastolic blood pressure of 80 to 89 mm Hg [1]. These individuals have higher prevalence of target organ damage[2]. Prehypertension is associated with increased left ventricular mass [3,4] increased left ventricular remodelling and impaired left ventricular diastolic function [5]. However, only about 12% of the cases of borderline hypertension (now termed prehypertension) develop left ventricular hypertrophy [6]. In other individual cardiac functions are affected by factors other than the magnitude of the blood pressure and left ventricular hypertrophy [7,8]. These individuals may not show echocardiographic evidence of left ventricular diastolic dysfunction at rest. Hypertension results in progressive, reduction in the compliance of the left ventricle [9].
Atria empty in the ventricles during diastolie. Long diastolic period at rest allows better emptying of the atria. This allows adequate fall in the pressure of the atria. Therefore the P wave can be normal in the resting electrocardiogram during early stages of impaired relaxation of the left ventricle. Tachycardia occurs at the cost of diastolic interval. Increasing heart rate during exercise results in progressive reduction in the diastolic interval. This is expected to hamper adequate emptying of the left atrium with consequent transient increase in the left atrial pressure. Presence of impaired relaxation of left ventricle is expected to result in more forceful contraction of the left atrial to fill the relatively stiff left ventricle. This factor is likely to add to the increase in the left atria pressure during exercise induced tachycardia. It is the therefore expected that early diastolic dysfunction in prehypertensive patients may be detectable only transiently during the exercise testing.
Abnormalities of the P wave of the electrocardiogram can give a clue regarding the volume and/or pressure of the atria thus indirectly about the diastolic pressures of the respective ventricle. Left atrial enlargement (Increase volume) produces wide P waves where as increases in the left atrial pressure increases negative terminal deflection of the P wave in lead V1 [10].
Diastolic stress test can help in unmasking abnormalities of the diastolic function appearing only during exercise [11]. This is possible only by Doppler echocardiography performed during supine bicycle exercise [12,13]. This is not possible during treadmill exercise test. Exercise induced changes in the P wave are expected to detect abnormalities of the diastolic function appearing only during exercise. Therefore we evaluated P wave changes during treadmill stress electrocardiography to detect presence of early diastolic dysfunction in prehypertensives without electrocardiographic or echocardiographic evidence of left ventricular hypertrophy or diastolic dysfunction.
Material and Methods
All individual reporting for treadmill test over last five years were analysed.
Inclusion criteria office,
(i)Age less than sixty years. With aging the heart become more fibrotic and stiff due to increase in the collagen content, fibrosis, deposition of cardiac amyloid and lipofuscin [14,15].Therefor aging perse producers left ventricular diastolic dysfunction [16].Further the diastolic blood pressure decreases after the age of sixty years due to increased stiffness and decreased recoil of large vessels [17,18,19].Most of such cases actually fall into the category of the early stage of isolated systolic hypertension rather then prehypertension. Increased central arterial stiffness perse also affects cardiac function independent of blood pressure reading [20].
(ii) Resting, supine, hospital, systolic blood pressure between 120 to 139 mm Hg and/or resting supine, diastolic blood pressure between 80 to 89 mm Hg [2]. Individuals with diastolic blood pressure less then 70 mm Hg were not included because increased. Pulse pressure perse is associated with impairment of left ventricular relaxation [21,22]. Decreased diastolic bloodpressure reduces coronary perfusion that also contribute to impaired relaxtion [20].
(iii) No history of treatment for hypertension. This criterion was used to avoid inclusion of patients of hypertension whose blood pressure readings could be in the range of prehypertension at the time of evaluation. Inclusion of such cases may give wrong impression of diastolic dysfunction in prehypertensives. Further, antihypertensive therapy can reduce left ventricular hypertrophy, [23,24] and it's impact on the left ventricular diastolic dysfunction
(iv) No history of treatment for ischemic heart disease including any history of coronary angioplasty or coronary artery bypass surgery. Myocardial ischemia perse can produce diastolic dysfunction.
(v)No history of smoking or chronic respiratory symptoms. No clinical or radiological evidence of chronic obstructive airway disease or emphysema.
(vi)Body mass index between 18.5 to 24.9. Overweight and obesity perse are associated with left ventricular diastolic dysfunction [25]. Overweight and obese individuals also have exaggerated increase in systolic blood pressure during exercise [26]. Increased afterload of the left ventricle results in increased left atrial pressure and consequent change In the P wave morphology irrespective of the resting blood pressure.
(vii)Normal fasting and post-prandrial blood sugar without any history of treatment for diabetes. Diabetes perse is associated with left ventricular, diastolic dysfunction [27]. Diabetic hypertensive individual also have greater left ventricular hypertrophy then individuals with isolated hypertension (28).
(vii) Normal fasting lipid profile.
(ix)Resting twelve lead electrocardiogram within normal limits.
(x) No abnormality on detailed echocardiographic examination including Doppler and tissue Doppler imaging.
Treadmill test protocol
Mason-Likar lead system [29] was used. All leads were correctly placed by qualified and experienced technician .The procedures was supervised by an experienced cardiologist .Bruce protocol [30] was followed. All the twelve leads were displayed on the monitor continuously and simultaneously. Exhaustion rather than age predicted target heart rate was taken as the end point [31]. Appearance of any arrhythmia, any intraventricular conduction defect, preexcitation or significant ST segment depression were also taken as end points. Patients were placed in supine position soon after completion of the exercises. Recovery was recorded for nine minutes to avoid missing any ‘only in recovery’ changes. Final report included print of raw electrocardiogram recorded at the end of each stage and averaged beats of all the twelve leads at the end of each stage. Recording was done at the standard speed of 25 mm/sec and 10mm/mV All the twelve leads were recorded in supine position, standing position and active hyperventilation before exercise.
Exclusion criteria
Patients with appearance of any of the following findings during standing, active hyperventilation, exercise or recovery were excluded from the final analysis.
(i) Any ectopic supraventricular rhythm
(ii) Any supraventricular tachyarrhythmia
(iii) Frequent ventricular ectopics
(iv)Ill sustained or sustained ventricular tachycardia
(v)Intraventricular conduction defect or preexcitation
(vi)Increase in systolic blood pressure to 210 mm Hg or more during exercise. Such persons are likely to have hypertension during day to day activity(masked hypertension).Cumulative effect of such hypertensive episodes could result in subclinical left ventricular diastolic dysfunction.
(vii) Excessive baseline shift or vibrations that prevented correct interpretation of the electrocardiogram
viii) Any doubtful change.
Final analysis of data
(i) Due to strict adherence to inclusion and exclusion criteria only twenty seven tests of isolated, uncomplicated prehypertensive patients qualified for final analysis.
(ii) Averaged beats recorded in supine position, in standing position, during active hyperventilation, at the start of exercise, at the end of each stage of exercise, at the end of first, third ,fifth ,seventh and ninth minute of recovery were analysed. In case of the any doubt respective raw electrocardiogram was also reviewed before making final decision.
(iii)For evaluation of the amplitude of the P wave, point of beginning of the P wave was taken as the zero reference level [33].
(iv)Demographic data of these twenty seven cases work compared with the demographic data of forty strictly normal individuals. Normal individuals were defined as individuals less than 60 years without any cardiorespiratory illness on detailed clinical electrocardiographic and biochemical investigations, body mass index between 18.5 to 24.9, resting supine office blood pressure 120/80 mm Hg or less and no abnormality during treadmill stress electrocardiography.
(v)Changes in the P wave were analysed in the averaged beats of all leads throughout the treadmill test and compared with changes in the normal individuals.
(vi)Terminal negative defection of the P wave in lead V1 equal to or more then 0.04 mV second(one small square or more in width and depth) was considerd suggestive of left atrial abnormality [34,35].
(vii)In fourteen cases, the terminal negative component of the P wave in lead V1 increased to 0.04mVsec or more during exercise and/or recovery .In the remaining thirteen cases the terminal negative part of the P Wave in lead V1 showed only downward slope with horizontal or downsloping PR segment as in corresponding lead V2 but there was no clear abnormal increase in the terminal negative component of the P wave in lead V1. Comparison with the downslop of the P wave in lead V2 also helped differentiation.
(viii) Observations of the fourteen cases who showed increase in the terminal negative component of the P wave in lead V1 suggestive of increased left atrial pressure during the treadmill test (named as group A) were compared with the observations in the thirteen cases who did not show any abnormal increase in the terminal negative component of the P wave in lead V1(named as group B)
(ix) Statistical analysis was performed using unpaired ‘T’ test
(x) Averaged beats of leads showing maximum change out of the following group of leads were selected for reproduction in figures.
-leads (I) and aVL
-leads (II,III) and aVF
-lead and aVR
-leads V1, V2
-leads V3, V4, V5, V6
Results
(3.1) Demographic data of total twenty seven prehypertensive patients were compared with the data of forty normal individuals. Results are shown in table 1. Prehypertensives had significantly higer resting supine systolic and diastolic blood pressure as compared to the normal individuals (P< 0>0.10). Prehypertensives had mildly higer resting supine heart rate (P=0.05).
Parameter | Normal | Prehypertensive | P Value | |
Number (M : F) | 40 (28:12) | 27 (20:7) |
| |
Age(Years) | 37.90 ± 2.93 | 39.20 ± 10.98 | >0.10 (NS) | |
Resting supine heart rate (bpm) | 72.32 ± 11.34 | 78.82 ± 12.93 | 0.05 (BS) | |
| Resting supine blood pressure (mmHg) |
115.95±4.54 |
129.67 ±7.84 |
<0> | |
| systolic | |||
| Diastolic | 75.02 ± 4.81 | 85.96±5.23 | <0> |
Abbreviations– SD -standard deviation, bpm- beats per minute, NS -Not significant BS -Borderline significance, HS – Highly significant.
Table1: Differences (Mean± SD) between demographic parameters of normotensive individuals and prehypertensive patient.
Changes in the P wave in leads other then lead V1.
Changes in the P waves other then leads V1were similar to the normal persons. With start of exercise and during stage one there was mild increase in the amplitude of the P wave. With increasing heart rate during exercise, the P wave gradually shifted towards the QRS complex. Amplitude and duration of the P wave progressively decreased and downslope of the P wave progressively merged into the rapidly downsloping PR segment (figure1-A) Changes were most prominent at peak exercise or during the first minute of recovery(marked) (figure1-B) During recovery, the P wave gradually came out of the PR segment. By the end of the fifth minute of recovery, the P wave become inentical to the preexercise P wave. At times P wave became normal by the end of the seventh minute of recovery. There was no visually detectable increase in the duration of the P wave in any lead in any case throughout the treadmill test.
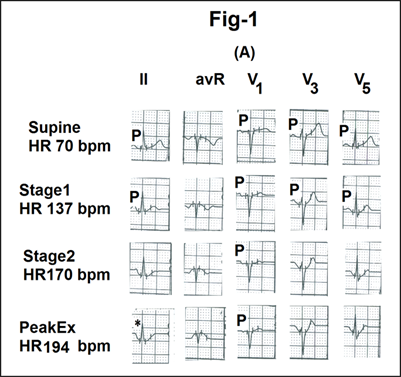
Fig1- Showing changes in the P waves and the PR segment in the averaged beats of different leads during different stages of treadmill test from a case of prehypertension.
(A)During stage 1, there is mild increase in amplitude of the P wave with mild decrease in its duration. With increasing exercise and heart rate there is progressive reduction in the amplitude of the P wave and merging of it’s distal limb in the down sloping PR segment.
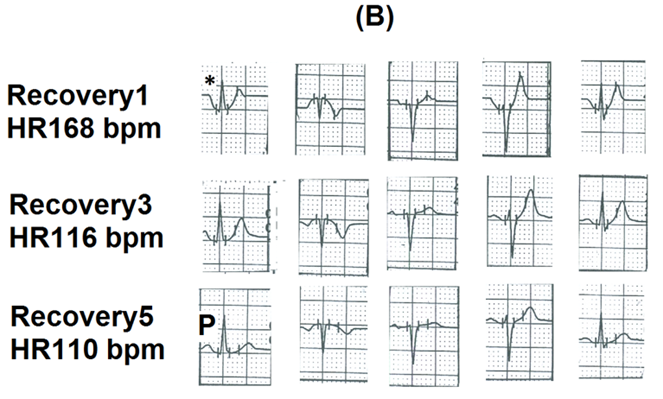
(B)With reducing heart rate during recovery, the P wave comes out of the PR segment.The P wave became normal by the end of the fifth minute of recovery.
Change in the P wave in lead V1
In fourteen patients the terminal negative deflection of the P wave became prominent enough to be defined as left atrial abnormality (termed as group A for further discussion) (figure2). In thirteen patients the downslope of the P wave merged into the downsloping PR segment but did not qualify to be termed as left atrial abnormality (termed as group B for further discussion)(figure3).
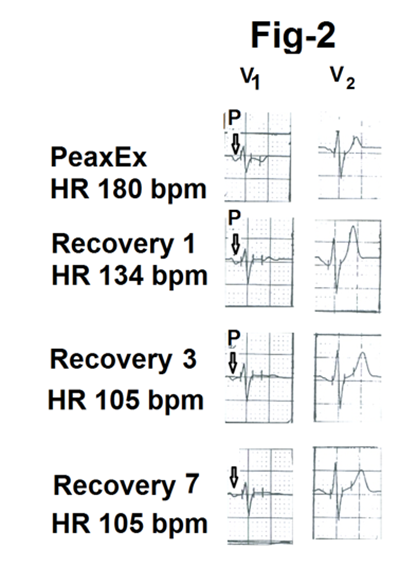
Fig2- Showing Lead V1 and V2 with abnormal increase in the terminal negative deflection of the P wave (marked as ↓)in lead V1 at peak exercise from a case of prehypertension suggestive of left atrial abnormality.
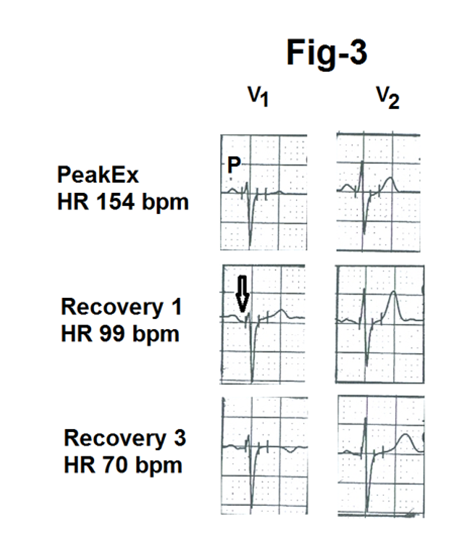
Fig3-Showing leads V1 and V2 during peak exercise, first minute of recovery and third minute of recovery from another case of prehypertension. Distal limb of the P wave (marked as ↓) merging in the down sloping PR segment. There is no evidence of left atrial abnormality.
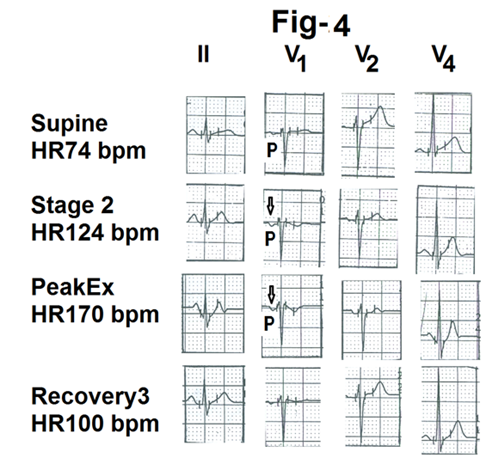
Fig-4-Showing different leads from the averaged beats during treadmill test of a case of group A of prehypertension. There is abnormal negative defection of the terminal part of the P wave in lead V1 at peak exercise (marked as ↓)
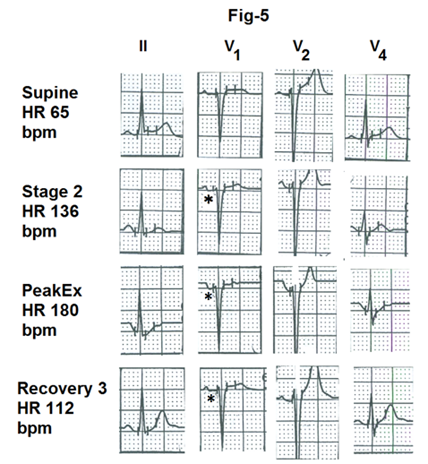
Fig5- Showing averaged beats from different leads of different stages of treadmill test from a prehypertensive of group B.There is horizontal depression of the PR segment in lead V1 (marked as *) without any evidence pf left atrial abnormality
Comparison of exercise and recovery parameters between group A and group B
Comparison of group A and group B are shown is tables 2,3 and 4. Resting supine systolic blood pressure was significantly more is group B (P < 0 P=0.01).> Parameter Group A (Patients with increase in the terminal negative component of the P wave in lead V1during thetreadmill test) Group B (Patients without any increase in the terminal negative component of the P wave of lead V1 during the treadmill test) P-value Number (M : F) 14(10:4) 13(9.4) Age(Years) 39.85 ± 11.97 34.8±11.13 >0.10 (NS) Resting supine heart rate (bpm) 76.6 ± 13.30 76.08±14.02 >0.10 (NS) Resting supine blood pressure (mm Hg) 120.86 ± 6.59 129.58±8.6 <0> Systolic Diastolic 86 ± 5.07 86.66 ± 4.92 >0.10 (NS) Pulse pressure 44.66 ±10.56 42.91 ± 10.96 >0.10 (NS)
Abbreviations – SD -standard deviation, bpm- beats per minute,NS-Not significant, BS -Borderline, significant,S – Significant.
Table2: Differences (Mean± SD) in demographic parameters between the two groups of prehypertensive patients.
| Parameter | Group A (Patients with increase in the terminal negative component of the P wave in lead V1 during the treadmill test) | Group B (Patients without any increase in the terminal negative component of the P wave in lead V1 during the treadmill test) | P-value |
| Exercise duration (minutes) |
8.89±2.06 |
9.8±1.84 |
>0.10 (NS) |
| Peak metabolicEquivalent(MET) |
10.13±1.55 |
10.99 ± 1.49 |
>0.10 (NS) |
| Peak systolic blood pressure (mm Hg) |
175.33 ± 8.72 |
178.33 ± 12.09 |
>0.10 (NS) |
Peak heart rate (bpm) |
163.13 ± 9.58 |
178 ±17.17 |
0.01 (S) |
Abbreviations – SD -standard deviation, bpm- beats per minute, NS -Not significant, BS -Borderline significant, S – Significant.
Table 3: Differences (Mean± SD) inexercise parameters between two groups of prehypertensive patients
Parameter | Group A (Patients with increase in the terminal negative component of the P wave in lead V1 during the treadmill test) | Group B (Patients without any increase in the terminal negative component of the P wave of lead V1 during the treadmill test) | P-value | |
| Systolic blood pressure at the end of the third minute of recovery (mm Hg) |
165.33±15.05 |
163.33±18.74 |
>0.10 (NS) | |
| Heart rate (bpm) reduction from the peak heart rate. |
32.73 ± 12.45 |
41.5 ± 18.2 |
>0.10 (NS) | |
| At the end of the first minute of recovery | |||
At the end of the third minute of recovery |
59.33 ± 15.92 |
74.16 ± 13.85 |
0.02 (S) | |
At the end of the fifth minute of recovery |
63 ± 17.05 |
76.08±12.65 |
<0> | |
Abbreviations- SD -standard deviation, bpm- beats per minute, NS-Not significant, BS -Borderline significant, S -Significant.
Table 4: Differences (Mean± SD) in the recovery parameters between the two groups of prehypertensive patients.
Discussion
Comparison of demographic data of prehypertensives with normotensive individuals
There was no significant difference in age and gender. Therefore changes seen in prehypertensives were most likely related to the significant difference in the systolic and the diastolic blood pressures. Prehypertensives had relatively higher (P=0.05) resting supine heart rate. This could be because of overactivity of the sympathetic nervous system. Increased sympathetic activity can case transient hypertension [36]. Prehypertension is known to be associated with increased resting heart rate [37].Increased sympathetic activity could also be contributing to the higher blood pressure.
Differences between group A and group B patients with prehypertension.
Patients of group A had significant increase in the area of terminal negative component of the P wave in lead V1 during treadmill test. This finding suggests transient increase in the left atrial pressure of these patients during treadmill test [10,38,39].
Why there was no visibly detected increase in the duration of the P wave in any of the prehypertensive patients?
Firstly as the increase in the left atrial pressure occurred for a short period during exercise and / or early recovery it did not result in dilatation of the left atrium. Wide and notched P wave are seen only if there is enlargement of the left atrium [10,40]. Secondly, sensitivity of the P wave in detecting left atrial enlargement is only around 8% [41]. Thirdly ,it has been shown (in the context of the diagnosis of exercise induced myocardial ischemia), that any detection of any meaningful increase in the duration of the P wave is possible only after magnifying the electrocardiogram serval times [42] and development software for correct measurement of such a minimal change (0.02 sec)[43].
why did the change in terminal negative component of the P wave occur only transiently during the treadmill test?
Prehypertensives are prone to target organ damage[2].In the context of heart the earliest abnormality is impairment of early diastolic active relaxation of the left ventricle. At rest the heart rate is slow. Long diastolic period allows adequate emptying of the left atrium inspite of impairment of early active relaxation of the left ventricle. During exercise induced tachycardia, there is progressive shortening of the diastolic interval. It hampers adequate emptying of the left atrium into the left ventricule. Consequently the left atrial pressure increases with increasing heart rate during exercise. In addition tachycardia also reduces reuptake of calcium by the sarcoplasmic reticulum [14]. This adds to the impairment of left ventricule relaxation during exercise induced tachycardia and adds to increase in the left atrial pressure .This leads to increased prominence of the terminal negative deflection of the P wave in lead V1.During recovery, the heart rate rapidly declines. It increases the diastolic interval and results in better emptying of the left atrium. Left atrial pressure declines and the terminal negative deflection of the P wave in lead V1 becomes normal. Grater is the impairment of relaxation of the left ventricule earlier is the appearance of the abnormality of the P wave in lead V1 during exercise and longer it lasts during recovery .
How to explain impairment of relaxation of the left ventricle how in the absence of electrocardiographic or echocardiographic evidence of left ventricular hypertrophy?
There are several reasons. Firstly, all hypertensive do not develop left ventricular hypertrophy [44] only 12% of borderline hypertensives (now termed as prehypertension) have left ventricular hypertrophy [6].This is because development of left ventricular hypertrophy in hypertensives is dependent on several factors other then blood pressure [7]eg. genetic predisposition, increase in blood pressure during day to day activity 24 hrs control of the blood pressure and central aortic pressure. Secondly the electrocardiographic and echocardiographic creteria for the diagnosis of left ventricular hypertrophy have low sensitivity [45,46,47]. Thirdly hypertension (greater than 180 mmHg) only during exercise can produce impaired relaxation during exercise but may not cause detectable left ventricular hypertrophy if patients do not develop hypertension during their day to day activity. Hypertensive response during exercise has been shown to be associated with new onet hypertension and future cardiovascular death [47,48,49]. Similarly, in some individuls recovery, from peak systolic blood pressure may be slow. Such a response is also releted to later risk of cardiovascular events [50]. These studies show that some individuals have adverse milieu that can cause impairment of cardiac function even in absence of left ventricular hypertrophy Fourthly initial stages of left ventricular pressure over load impairment of relaxation in due to electrophysiological changes at the cellular level [35]. Myocardial relaxation is primarily due to reuptake of the calcium ions by sarcoplasmic reticulum (s1). Therefore electrocardiogram and echocardiographic evaluation may be within normal limits during the early stages of impaired relaxation in case of systemic hypertension. Fifthly intrinsic myocardial stiffness relaters to the amount of collagen within the myocardiam 52.There could be increased deposition of collagen in patients of group A.
Why did the change in the P wave terminal negative component the P wave of lead V1 occur only in fourteen case of group A and not in the remaining thirteen case of group B.
None of the twenty seven patients had electrocardiographic or electrocardiographic changes of left ventricular hypertrophy. Therefore difference in diastolic dysfunction was due to some other factors. There are some possibilities. firstly the individuals of group ‘B’ could be having white coat hypertension i.e. ‘only in office hypertension’ which resulted in their clinic blood pressure reading to rise to the range of prehypertension. Such individuals have much lower cardiovascular morbidity [53]. Secondly, there could be some genetic factors that could have contributed to greater impairment of relaxation in patients of group ‘A’[8] Thirdly some authors of have observed increased levels of inflammatory markers in prehypertensives. It is possible that our patients of group A had increased levels of inflammatory factors. Fourthly, cardiac changes are more dependent on central aortic pressure & stiffness of large arteries [20,55] rather than on the brachial artery pressure. It is possible that our patients of group A had higher central aortic pressure.
Differences in the demographic parameters between group A and group B
Patients who did not develop abnormality in the terminal negative defection of the P wave in lead V1 (group B) had higher systolic blood pressure at rest as compared to individuals of group A (P<0>
Increased stiffness (decreased recoil)of the great arteries reduces the systolic blood pressure in the presence of increased in systolic blood pressure [20].As there was no significant difference in the other parameters, the difference was most likely due to better left ventricular stroke volume in patients of group B. Indirectly it suggests better diastolic filling and better systolic emptying of the left ventricle i.e better diastolic and systolic function of the left ventricle in group B patients.
Differences the in exercise parameters of group A and group B
Peak exercise heart rate was significantly higher in group B then in group A (P=0.01).This could be because patients of group B could exercise for a longer duration (9.8+-1.84 minutes)than the patients of group A (8.89+-2.06minutes).Although the difference in duration of exercise did not reach statistical significance, it does show that the patients of group B had better exercise tolerance. Relatively less exercise tolerance in patient of group A could be related to impaired relaxation of the left ventricle in these patients as shown by increased prominence of the terminal negative deflection of the P wave in lead V1 in these patients during exercise. Increased prominence of the terminal negative deflection of the P wave in lead V1 suggests increased pressure in the left atrium and indirectly to increased pulmonary venous pressure. Increased pulmonary venous pressure results in breathlessness and could be responsible for relatively early termination of exercise in patients of Group A.
Difference between recovery parameters between group A and Group B
Reduction in the heart rate at the end of the third minute of recovery and at the of end the fifth minute of recovery was significantly less (p=0.02 and <0>
Conclusion
Some patients of isolated uncomplicated prehypertension (as define by resting, supine, office blood pressure reading) without any electrocardiographic or echocardiographic evidence of left ventricular hypertrophy can have subclinical impairment of relaxation of the left ventricle. Such subclinical impairment of relaxation of the left ventricle can be unmasked by exercise electrocardiography using treadmill test. Increase in the area of the negative terminal deflection of the P wave of lead V1 to 0.04mVsec or more during exercise or early recovery suggest transient increase in the left atrial pressure due to exercise induced tachycardia.
References
- Chabanian AV, Bakris GL, Black HR, et al. (2003). The seventh report of the Joint National Committee on prevention, detection, evaluation and treatment of high blood pressure the JNC 7 report.JAMA 289:2560-2572.
View at Publisher | View at Google Scholar - Julius S, Feldstein CA. (2013). Prehypertension: Definition, clinical significance and therapeutic approaches. To treat or not to treat? In Berbari AE, Mancia G (eds).Special issues in hypertension. Springer (India).New Delhi; 3-12.
View at Publisher | View at Google Scholar - Kokkinos P, Pittaras A, Narayan P, et al. (2007). Exercise capacity and blood pressure associations with left ventricular mass in prehypertensive individuals. Hypertension 49 : 55-61
View at Publisher | View at Google Scholar - Drukteinis JS,Roman MJ, Fabsitz RR, et al. (2007). Cardiac and hemodynamic characteristics of hypertension and prehypertension in adolescents and young adults : the Strong Heart Study . Circulation 115:221-227.
View at Publisher | View at Google Scholar - Santos AB, Gupta DK, Bello NA, et al. (2015). Prehypertension is associated with abnormalities of cardiac structure and function in the Atherosclerosis Risk in Community Study . Am J Hypertens pii;hpv 156.
View at Publisher | View at Google Scholar - Hammond IW, Devereux RB,Aldermann MA. (1986). The prevalence and correlates of echocardiographic left ventricular hypertrophy among employed patients with uncomplicated hypertension. J Am Coll Cardiol. 7:639-650.
View at Publisher | View at Google Scholar - Diamond JA, Phillips RA. (2008). Left ventricular hypertrophy, congestive heart failure and coronary flow reserve abnormalities in hypertension. In : Oparl S, Weber MA(eds) Hypertension , Elsevier, Gurgaon; 250-280.
View at Publisher | View at Google Scholar - Cruickshank JM. (2013). End-organ damage in essential hypertension. In: Cruickshank JM. Essential hypertension. People’s Medical Publishing House, USA; 237-294.
View at Publisher | View at Google Scholar - Mittal SR. (2023). Left ventricular systolic overload (pressure overload ). In Mittal SR. Insights into Electrocardiograms with.MCQs. Springer Nature,Singapore; 471-490.
View at Publisher | View at Google Scholar - Kasser I, Kennedy JW. (1969). The relationship of increased left atrial volume and pressure in abnormal P wave on the electrocardiogram. Circulation; 39:339-343.
View at Publisher | View at Google Scholar - Kane GC, Oh JK. (2012). Diastolic stress test for the evaluation of external dyspnoea. Curr Cardiol Rep 14:359-365.
View at Publisher | View at Google Scholar - Ho JW, Oh JK, Palikka PA, et el. (2005). Diastolic stress echocardiography: a novel noninvasive diagnostic test for diastolic dysfunction using supine bicycle exercise echocardiography. J Am Echocardiogr,18:63-65.
View at Publisher | View at Google Scholar - Armstrong WF, Ryan T. (2010). Evaluation of left ventricular diastolic function. In: Armstrong WF, Ryan T(eds). Feigenbaum’s Echocardiography.Wolters Kluwer, Philadelphia:159-183.
View at Publisher | View at Google Scholar - Fleg JL,Strait J. (2012). Age associated changes in cardiovascular structure and function:a fertile milieu for future disease. Heart Fail Rev,17:545-554.
View at Publisher | View at Google Scholar - Stolker JM, Kim DH,Rich MW. (2017). Cardiovascular disease in the elderly: pathophysiology and clinical implications.In:Fuster V, Harrington RA, Narula J,Eapen ZJ(eds).Hurst’s The Heart. Mc Graw Hill ,New York ; 1571-1593.
View at Publisher | View at Google Scholar - Chen MA. (2012). Aging changes seen on echocardiography.In: Otto CM (ed).The practice of echocardiography .Elsevier, Philadelphia; 774-790.
View at Publisher | View at Google Scholar - Guranatharo PS, Manjunatha A,Kanti DK. (2015). Evaluation of arterial stiffness in elderly with prehypertension.Indian J Physiol Pharmacol ;59:16-22.
View at Publisher | View at Google Scholar - Kennedy L. (2011). Isolated systolic hypertension; In Kennedy L. Problem solving in hypertension. Oxford,UK; 36-42.
View at Publisher | View at Google Scholar - Forman DE,Fleg JL,Wenger NK. (2019). Cardiovascular disease in the elderly.In:Zipes DP ,Libby P, Banow RO,Mann DL,Tomaelli GF.(eds).Braunwald’s Heart Disease.Elsevier, Philadelphia 1735-1766.
View at Publisher | View at Google Scholar - Wong ND,Franklin SS. (2017). Epidemiology of Hypertension In: Fuster V, Harrington RA, Narula J,Eapen ZJ (eds). Hurst’s The Heart. MC Graw Hill, New York; 703-719.
View at Publisher | View at Google Scholar - Franklin SS. (2005). New interpretation of blood pressure: The importance of pulse pressure .In: Oparil S, Weber MA(eds).Hypertension.Elsevier,Gurgaon; 230-236.
View at Publisher | View at Google Scholar - Benetos A, Zureik M, Morcet J, et al. (2000). A decrease in diastolic blood pressure combined with an increase in systolic blood pressure is associated with a higher cardiovascular mortality in men. J Am Coll Cardiol; 35:673-680.
View at Publisher | View at Google Scholar - Verdecchia P, Staessen JA Angeli F, et al. (2009). On behalf of the Cardio-Sis investigators. Usual versus tight control of systolic blood pressure in non diabetic patients with hypertension (Cardio-Sis) :an open label randomized trial. Lancet, 374:525-533
View at Publisher | View at Google Scholar - Voctor RG,Libby P.Systemic hypertension management .In: Zipes DP,Libby P, Bonow RO ,Maan DL,Tomaselli GF(eds).Braunwald’s Heart Disease. Elsever: Philadelphia; 2019:928-956.
View at Publisher | View at Google Scholar - Pascual M,Pascual PA,Soria F,et al.Effect of isolated obesity on systolic and diastolic left ventricular function.Heart 2003;89:1152-1156.
View at Publisher | View at Google Scholar - Cartelli L,Rodrigues AN, Perz AJ, Vassalo DV.Blood pressure response to physical exertion in adolescents:influence of overweight and obesity.Arq Bras Cardiol 2008: 91:24-28.
View at Publisher | View at Google Scholar - Boyer JK, Thanigaraj S, Schechtman KD, Perez JF. Prevalence of ventricular diastolic dysfunction in asymptomatic ,normotensive patients with diabetes mellitus. Am J Cardiol 2004;43:870-875.
View at Publisher | View at Google Scholar - van Haeven KH, Factor SM.A comparison of the pathological spectrum of hypertensive, diabetic heart disease. Circulation 1990;82:850-855.
View at Publisher | View at Google Scholar - Mason RE,Likar Z. A new system of multiple lead exercise electrocardiography. Am Heart J 1996;71:196-205.
View at Publisher | View at Google Scholar - Bruce R, Blackman J, Jones Strait J. Exercise testing in adult normal subjects and cardiac patients. Paediatrics 1963;32:742-756
View at Publisher | View at Google Scholar - Jain M, Nikonde C, Lin BA, et al. 85% of age predicted heart rate is not a valid end point for exercise treadmill testing. J Nucl Cardiol 2011;18;1026-1035.
View at Publisher | View at Google Scholar - Balady GJ,Morise AP.Exercise electrocardiographic testing. In:Zipes DP,Libby P,Bonow RO, Mann DL, Tomaselli GF (eds).Braunwald’s Heart Disease. Elsevier, Philadelphia;2019:157-173.
View at Publisher | View at Google Scholar - Ahmad M,Blomquist G. P wave changes during exercise in normal subjects and in patients with hemodynamic evidence of left atrial overload .J Electrocardiology 1978;11:361-368.
View at Publisher | View at Google Scholar - Gering LE,Surawicz B,Knilans TK, Tavel M. Atrial abnormalities.In:Surawicz B, Knilans TK
View at Publisher | View at Google Scholar - Mirvis DM, Goldberger AL.Electrocardiography .In:Mann DL,Zipes DP,Libby P,Bonow RO (eds).Braunwald’s Heart Disease.Elsevier,Philadelphia,2015:144-152.
View at Publisher | View at Google Scholar - Leavy RL,White P D, et al.Transient tachycardia: prognostic significance alone and in association with transient hypertension. JAMA 1995;129:585-588
View at Publisher | View at Google Scholar - King DE, Everett CJ, Mainous AG, Liszka HA. Long term prognostic value of resting heart rate in subjects with prehypertension. Am J Hypertens 2006;19:796-800.
View at Publisher | View at Google Scholar - Sutnick AI, Soloff LA. Posterior rotation of the atrial vector: an electrocardiographic sign of left ventricular failure.Circulation 1962;26:913-916
View at Publisher | View at Google Scholar - Romhilt DW, Scott RC. Left atrial involvement in acute pulmonary oedema. Am Heart J 1972;83:328-331
View at Publisher | View at Google Scholar - Goldberger AL , Goldberger ZD, Shvilkin A. Atrial and ventricular enlargement. In: Goldberger AL , Goldberger ZD, Shvilkin A (eds). Goldberger’s Clinical Electrocardiography.
View at Publisher | View at Google Scholar - Tsao CW, Josephson ME, Hauser TH, et al. Accuracy of electrocardiographic criteria for atrial enlargement: validation with cardiovascular magnetic resonance. J Cardiovasc Magn Reson 2008;10:7.
View at Publisher | View at Google Scholar - Wsol A, Wydra W, Chmietewski M, et al. Increased sensitivity of prolonged P wave during exercise test in detection of angiographically documented coronary artery disease. Cardiol J 2017;24:159-166.
View at Publisher | View at Google Scholar - Thomas GS, Samtani SR, Ellestad MH. Interpretation of the ECG during exercise and recovery. In:Thomas GS, Wann LS, Ellestad MH (eds). Ellestad’s Stress Testing. Oxford, New Delhi ;2018:160-198.
View at Publisher | View at Google Scholar - Johnson WR. Management of patients with left ventricular hypertrophy.In:Weir MR(ed). Evidence based management of hypertension. tfm Publishing Limited , UK ; 2010:131-154.
View at Publisher | View at Google Scholar - Pewsner D, Juni P, Egger M, et al. Accuracy of electrocardiography in diagnosis of left ventricular hypertrophy in arterial hypertension :systemic review. BMJ 2007;335:711-720.
View at Publisher | View at Google Scholar - Gertsch M. Left ventricular hypertrophy. In: Gertsch M. The ECG manual. Springer; London ;2009:45-58
View at Publisher | View at Google Scholar - deLuna AB. Ventricular enlargement. In:deLuna AB. Basic Electrocardiography.Blackwell Futura, Massachusetts, USA;2007:39-49.
View at Publisher | View at Google Scholar - Weiss SA, Blumenthal RS, Sharatt AR, et al. Exercise blood pressure and future cardiovascular death in asymptomatic individuals. Circulation 2010;121:2109-2116.
View at Publisher | View at Google Scholar - Allison TG,Cordeiro MA, Miller TD, el al. Prognostic significance of exercise induced systemic hypertension in healthy subjects. Am J Cardiol 1999;83:371-375.
View at Publisher | View at Google Scholar - Laukkanen JA, Kurl S, Salonen R, et al. Systolic Blood pre4ssure during recovery from exercise and the risk of myocardial infarction in middle aged men. Hypertension 2004;44:820-825.
View at Publisher | View at Google Scholar - Bers DM, Borlaus BA. Mechanism of cardiac contraction and relaxation. In: Zipes DP, Libby P.Bonow RO, Mann DL,Tomaselli GF(eds). Braunwald’s Heart Disease. Elsevier, Philadelphia;2019:418-441.
View at Publisher | View at Google Scholar - Janicki JS.Myocardial collagen remodelling and left ventricular diastolic function. Braz Med Biol Res 1992;25:975-982.
View at Publisher | View at Google Scholar - Franklin SS, Thijs L; Asayama K, et al. The cardiovascular risk of white- coat hypertemsion. J Am Coll Cardiol 2016;68:2033-2043.
View at Publisher | View at Google Scholar - Nandeesha H, Bobby Z, Selvaraj N, Rajappa M. Prehypertension: is it an inflammatory state . Clin Chim Acta 2015;451(pt B):338-342.
View at Publisher | View at Google Scholar - Roman MJ, Devereur RB, Kizer JR, et al. Central pressure more strongly relates to vascular disease and outcome than does brachial pressure : the Strong Heart Study. Hypertension 2007;50:197-203.
View at Publisher | View at Google Scholar - Mittal SR.Blood pressure response to treadmill stress testing-interpretation and critical appraisal . J Cardiol 2023;7.
View at Publisher | View at Google Scholar - Mittal SR. Significance of heart rate profile during treadmill stress test-A critical appraisal. J Cardiol 2021;5.
View at Publisher | View at Google Scholar -
View at Publisher | View at Google Scholar
