

Research Article | DOI: https://doi.org/10.31579/2834-796X/023
Diagnostics of Diastolic Dysfunction of the Left Ventricle of the Heart by Spectral Analysis of a Single-Channel Electrocardiogram
1 ADAM University, Bishkek, Kyrgyzstan
2 Hebei DSF Geos Technology Co., LTD, China
3 National Academy of Sciences of the Kyrgyz Republic, Institute of Mountain Physiology and Medicine.
*Corresponding Author: Ishenbai Moldotashev, ADAM University, Bishkek, Kyrgyzstan.
Citation: I.K. Moldotashev, Yu. A. Bogdanov, A. A. Sorokin, M. Imran. (2023), Diagnosis of Diastolic Dysfunction of the Left Ventricle of the Heart by Spectral Annalysis of a Single-Channel Electrocardiogram, International Journal of Cardiovascular Medicine, 2(4); DOI:10.31579/2834-796X/023
Copyright: © 2023, Ishenbai Moldotashev. This is an open access article distributed under the Creative Commons Attribution License, which permits unrestricted use, distribution, and reproduction in any medium, provided the original work is properly cited.
Received: 15 May 2023 | Accepted: 23 August 2023 | Published: 31 August 2023
Keywords: echocardiography; spectral analysis of a single-channel electrocardiogram
Abstract
Assessment of diastolic function of the left ventricle (LVDF) makes it possible to detect chronic heart failure (CHF) at the preclinical stage of development, when its progression can still be prevented. Doppler echocardiography (DEHOKG) is the most accurate non-invasive diagnostic method for left ventricular diastolic dysfunction (LVDD), requiring expensive equipment and trained professionals. The development of an accessible screening method for the diagnosis of LVDD is an urgent and practically significant task.
Purpose of the study: to study the diagnostic value, sensitivity and specificity of the method of spectral analysis of a single-channel electrocardiogram (OECG) proposed by us for the diagnosis of left ventricular diastolic dysfunction in comparison with DEHOCG as a reference.
Material and methods: The study involved 60 people (35 patients on program hemodialysis with arterial hypertension and 25 practically healthy individuals) aged 20 to 65 years. Among them were 36 men and 24 women. DEHOCG was performed on the SonoSite Micro Maxx Belse X2 apparatus. LVLF was determined according to the generally accepted method. OECG was taken with portable recorder DuoEK 118 from Lepu Medical. LVLF was determined by ECG spectral analysis as the ratio of the sum of harmonic power in the period of early diastolic filling to the sum of harmonic power during the period of atrial contraction.
Results: The sensitivity of the method developed by us was 0.81, and the specificity was 0.72. Chi-square: 15.043, P=0.000 - the presence of a relationship is statistically highly significant. Phi=0.514, P=0.000 - the presence of a connection is highly significant. Area Under the Curve is 0.766+0.067 with a confidence interval of 0.635 to 0.896. The obtained values indicate that OECG scores are fairly good predictors of LVDD.
Conclusion: Spectral analysis of OECG has a high sensitivity and sufficient specificity for the diagnosis of LVDD. This method can be used for remote mass screening studies for the purpose of preclinical diagnosis of CHF.
Introduction
CHF is the outcome of almost all cardiovascular diseases. Its prevalence increases with age, from about 1% for people under 55 years of age to over 10% for people aged 70 years and older. Its causes in most cases are coronary heart disease and arterial hypertension (1). Studies combining the Framingham Heart Study and the CVD study cohorts report a mortality rate of 67% within 5 years of HF diagnosis (2). From the point of view of modern ideas about the cardiovascular continuum, cardiovascular diseases occur under the influence of risk factors and then steadily progress, eventually complicating CHF. At the same time, LVDD is first detected as a compensatory reaction to an increase in pressure in the left ventricle and / or the development of atherosclerotic cardiosclerosis, which later turns into diastolic heart failure, when clinical signs of CHF already appear. This stage is called CHF with a preserved left ventricular ejection fraction, which can last for quite a long time, subsequently being complicated by systolic heart failure, leading to a tragic ending (3). To prevent the progression of CHF, it is very important to diagnose it at the stage of LVDD, when therapeutic and prophylactic interventions are most effective. Currently, for this purpose, the DEHOCG method in various modifications is widely used in clinical practice. However, this method cannot be used for mass population screening studies due to the fact that expensive equipment, trained specialists and a long time for examination are required. In this regard, the paper proposes to use a new method for diagnosing LVDD, which is verified with the DEHOCG method as a reference.
Purpose of the study:
to study the diagnostic value, sensitivity and specificity of the method of spectral analysis of a single-channel electrocardiogram (OECG) proposed by us for the diagnosis of left ventricular diastolic dysfunction in comparison with Doppler echocardiography as a reference.
Material and Methods
The study involved 60 people (35 patients on program hemodialysis with arterial hypertension and 25 practically healthy individuals) aged 20 to 65 years. Among them were 36 men and 24 women. DEHOCG was performed on the Sono Site Micro Maxx Belse X2 apparatus. LVLF was determined according to the generally accepted method (4). OECG was taken with portable recorder Duo EK 118 from Lepu Medical (Figure. 1).
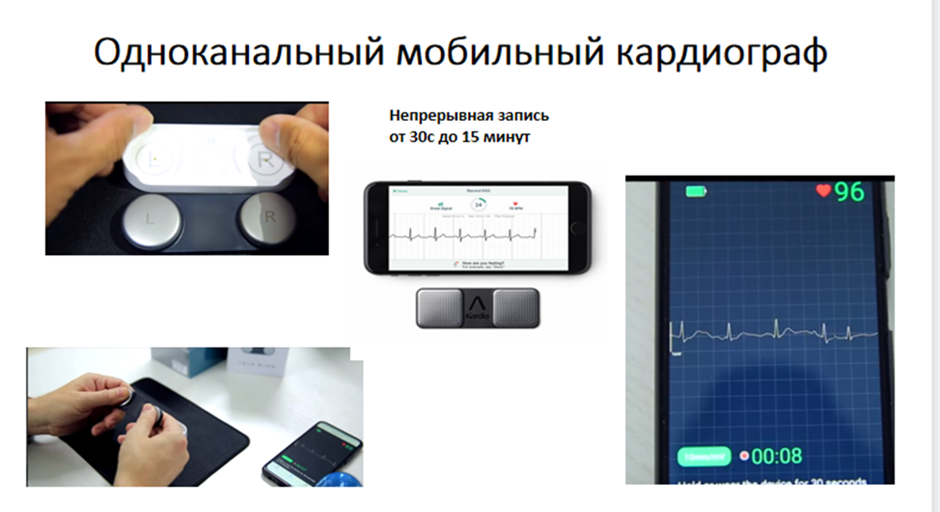
Figure 1: A single-channel mobile cardiograph is used to take an ECG from the fingers, followed by signal transmission via a smartphone to a center for spectral analysis.
The LV LVL using spectral analysis of the ECG was determined as the ratio of the sum of the power of harmonics in the period of early diastolic filling to the sum of the power of the harmonics in the period of atrial contraction. within a given time interval. An improved Bartlett and Welch method (5) was used for temporal averaging. In it, the time series of the ECG recording is divided into overlapping segments. Then a modified periodogram is calculated for each segment, and then these estimates are averaged to obtain an estimate of the power spectral density of the signal.
The most common representation of a spectrogram is a two-dimensional diagram: the horizontal axis represents time t, the vertical axis represents frequency F; the third dimension - the power at a certain frequency at a particular point in time is displayed by the brightness or color of each point of the image (Figure. 2).
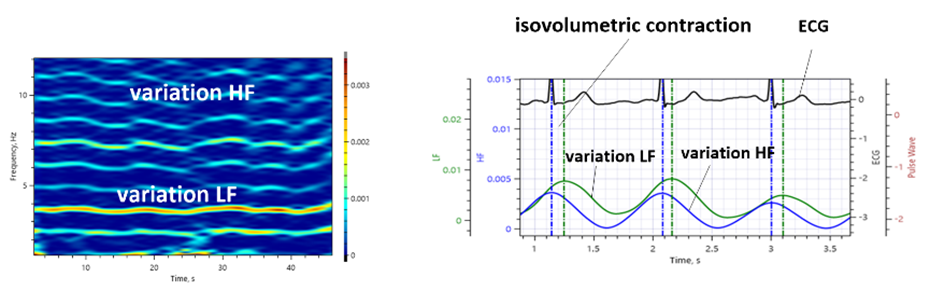
Figure 2: Typical view of the ECG spectrogram (on the right) and diagram of the time delay of the spectral power of signals of low frequency LF variability relative to high frequency HF.
Thus, the cardiosignal processing algorithm is based on the principle of selecting variations in broadband signals of the cardiogramLF of the time series components, HF variational cycles and determining their delay relative to each other (signal response delay). Average time delay between the first maximum of the variability of the spectral power of signals (HF), coinciding in time with the R-wave and the neighboring maximum of variability (LF) of the vascular system of the body determines the interval of isovolumetric contraction of the heart (Fig. 2). It is typical that the time is formed by the cardiovascular system itself and is its main property.
In view of the inertia of the walls of the vessels, the achievement of the highest pressure value occurs with a time delay. At the same time, stretching of the walls is accompanied by their tension and a concomitant increase in the intensity of the cardiosignal. In this case, the intensity signal changes its shape, which is reflected in the spectral composition of the radiation and, accordingly, in the variability of the spectral power of the signals (LF) and (HF) of the vascular system of the body. Thus, both diastole and systole phase signals are present in the ECG signal spectrum. On the graphs of the spectral power, this manifests itself in the form of two-level vertices (Figure. 3).
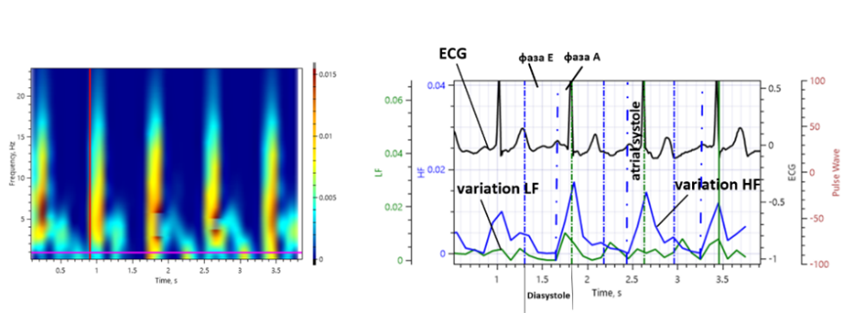
Figure 3: A typical view of the ECG spectrogram (on the right) with short segments of analysis and a diagram of the delay of the spectral power of the LF and HF variability signals.
Figure 3 shows how diastole and atrial systole intervals are determined. At these intervals, we obtain electrocardiographic signals of the power spectra for fragments of phase E and phase A, which is illustrated in Figure. 4.
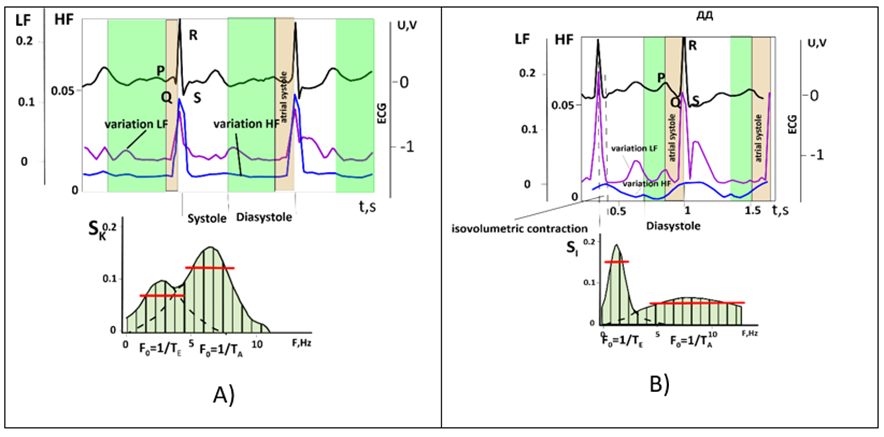
Figure 4: Diagram of sums of harmonic power during early diastolic filling and sum of harmonic power during atrial contraction: a) - for a healthy body, c) with signs of diastolic dysfunction, where TE, TA are the period of the fundamental harmonic of oscillations of the signal of phase E and A, respectively, FE and FA - frequencies of fundamental harmonics
LVEF was determined by ECG spectral analysis as the ratio of the sum of harmonic power during early diastolic filling (E) to the sum of harmonic power during the period of atrial contraction (A). If the E/A ratio was greater than 1, normal diastolic function was diagnosed, if less 1 that was determined by DDLV. The frequency intervals were determined by the width of the cardiosignal power at a level of 0.7 from the maximum value of the power spectrum of the E and A components in the vicinity of their fundamental harmonic frequencies F0=1/TE and F0=1/TA.
Results
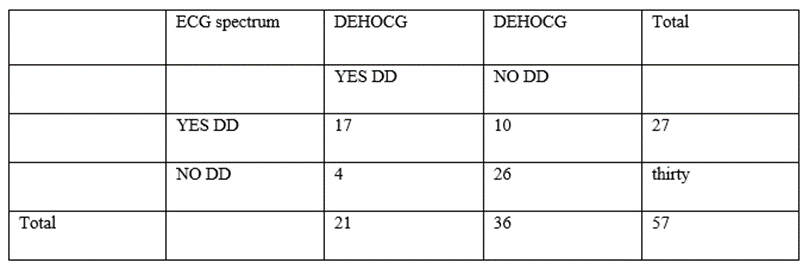
Table 1: Sensitivity and specificity of a spectral electrocardiogram (ECG spectrum) compared with Doppler echocardiography (DEHOKG).
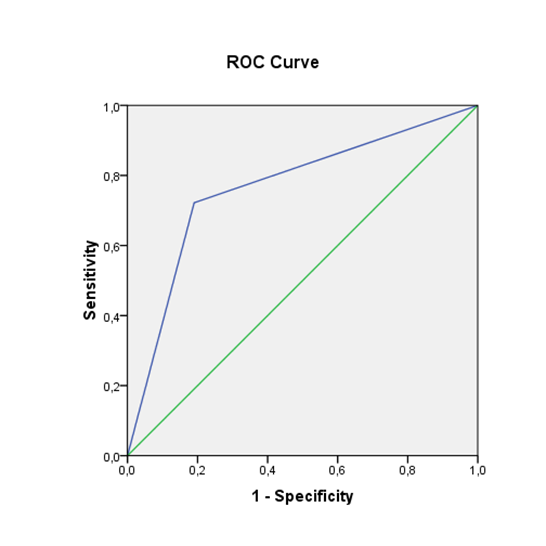
Figure 5: The ROC curve is a widely used method for evaluating the diagnostic performance of a test by plotting true positives (sensitivity) versus false positives (1-specificity). The curve provides an estimate of the overall accuracy of the test in distinguishing between positive and negative cases.
area |
Std. error |
Asymptotic Sig. | Asymptotic 95% Confidence Interval | |
lower bound | upper bound | |||
0.766 | 0.067 | 0.001 | 0.635 | 0.896 |
Table 2: Area under the curve (AUC) estimates
AUC (Area Under the Curve) - area under the curve is a summary statistics of the ROC curve with values ranging from 0.5 (indicating random recognition) to 1.0 (indicating perfect recognition). The higher the AUC value, the better the diagnostic performance of the test.
The sensitivity of the method developed by us was 0.81, and the specificity was 0.72. Chi-square: 15.043, P=0.000 - the presence of a relationship is statistically highly significant. Phi=0.514, P=0.000 - the presence of a connection is highly significant. Area Under the Curve is 0.766+0.067 with a confidence interval of 0.635 to 0.896. The obtained values indicate that OECG scores are fairly good predictors of LVDD.
Discussion
Diastolic dysfunction is a pathophysiological condition associated with impaired myocardial relaxation and/or decreased compliance of the left ventricle, leading to increased filling pressure in the left ventricle (6). At the beginning, it is compensatory in nature, but sooner or later the compensatory mechanisms are depleted, clinical symptoms of CHF appear, and the stage of diastolic heart failure sets in, which is now also called heart failure with preserved left ventricular ejection fraction (7.8). However, it is important to understand that, although DD is the main factor leading to the development of heart failure with preserved left ventricular ejection fraction, these terms are not interchangeable in the light of current understanding (9). Considering the inevitable progression of DD to diastolic and then to systolic heart failure, it becomes clear that preclinical diagnosis of CHF at the stage of DD is necessary (10,11). The urgency of such a task also increases due to its high prevalence, from 20 to 36% in the population (3.12). The value of diagnosing LVDD has also been proven for predicting the outcomes of cardiac surgery (13,14,15).
The most accurate diagnosis of DD can be made invasively, but this method cannot be used for wide clinical practice (3.7). ECHOCG is currently the most commonly used non-invasive assessment of LVDD (3,4,6). The identification of LVDD is based on a comprehensive assessment of a large number of echocardiographic parameters: the size and volume of the left atrium, the Doppler indicators of the transmitral flow and the flow of the pulmonary veins, data from tissue Dopplerography, computed tomography and two-dimensional tracking of grayscale spots (speckle tracking imaging or 2D-strain) (6, 16,17,18). In general clinical practice, the DEHOCG method is most often used (19). This determines the ratio of the rate of early diastolic filling (E) to the rate of blood flow in the phase of atrial contraction (A). According to the E/A ratio, the degree of diastolic relaxation is assessed, which can characterize myocardial stiffness. According to the results of DEHOCG, LVDD is divided into 3 stages: 1) mild (grade 1 or 1a), defined as impaired relaxation without or with mild signs of increased filling pressure, respectively; 2) Moderate (Grade 11), defined as impaired relaxation associated with a moderate increase in filling pressure or pseudo-normal filling; and 3) severe, defined as marked reduction in compliance or reversible (grade 111) or fixed (grade 1Y) restrictive filling (3).
Tagged cardiac magnetic resonance imaging can be used as a non-invasive method to obtain information about myocardial deformity and assess LV LV (20). However, the limited temporal resolution of MRI, along with high costs, limits its widespread use. DEHOCG methods also cannot be used for mass screening studies due to the need for expensive equipment and the need for trained specialists. In this regard, the evaluation of LV LV using ECG deserves attention (21,22). Holmqvist et al. (22) proposed to use the new Tend-P / (PQxAge ECG index for LVDD, the accuracy of which increases with the addition of the left atrial volume index. The disadvantage of this method is the need for joint use of ECG and EchoCG. (23) revealed single-channel ECG parameters that are highly correlated with the presence of significant diastolic and systolic LV dysfunction. The authors recommend the use of these parameters for remote assessment of myocardial function. The disadvantages of the proposed method include as indicated by the authors themselves, restrictions on the use, for example, in the case of a study of patients who had rhythm and conduction disturbances of the heart. In addition, there are certain methodological difficulties in determining such parameters as the maximum steepness of the teeth, difficulties in determining the markers of the beginning or end of the wave (P, QRS), and the shift in the maximum values. In contrast, our proposed method has the following advantages: automatic determination of the onset and end of phase E and phase A, determination of the contribution of each harmonic to the total cardio-signal, which allows mathematical modeling of various pathological conditions of the body (24).
Thus, the method of spectral analysis of OECG proposed by us has high sensitivity and sufficient specificity for diagnosing LVDD. This method can be used for remote mass screening studies for the purpose of preclinical diagnosis of CHF.
References
- McDonagh TA, Metra M., Adamo M et al. (2021) ESC guidelines for the diagnosis and treatment of acute and chronic heart failure: developed by the task force for the diagnosis and treatment of acute and chronic heart failure of the European Society of Cardiology (ESC) with the special contribution of the Heart Failure Association (HFA) of the ESC. European Heart Journal, volume 42, Issue 36, 21 September 2021, Pages 3599-3726.
View at Publisher | View at Google Scholar - Tsao CW, Lyass A, Enserro D et al. (2018) Temporal trends in the incidence of and mortality associated with heart failure with preserved and reduced ejection fraction. JACC Heart Fail 6:678-685.
View at Publisher | View at Google Scholar - Siu-Hin Wan, Mark W Vogel, Horng H Chen. (2014) Pre-clinical diastolic dysfunction. J Am Call Cardiol. Feb 11, 63(5): 407-16.
View at Publisher | View at Google Scholar - Carol Mitchell, Peter S. Ranko, Lori A. Blauncet et al. (2019) Guidelines for performing a comprehensive transthoracic echocardiografic examination in adults: recommendations from the American Society of Echocardiography. Guidelines and standards v.32, issue1, p.1-64.
View at Publisher | View at Google Scholar - Marple Jr. S.L. (1990) Digital spectral analysis and its applications. - M.: MIR. - S. 584
View at Publisher | View at Google Scholar - Nagueh SF, Appleton CP, Gillebert TC, et al. Recommendations for the evolution of left ventricular diastolic function by echocardiograpy. J Am Soc Echocardiogr. 22:107-33.
View at Publisher | View at Google Scholar - Oktay AA, Shah SJ. (2015) Diagnosis and management of heart failure with preserved ejection fraction: 10 key lessons. Curr Cardiol Rev 11(1):42-52.
View at Publisher | View at Google Scholar - Del Buono MG, Buckley L, Abbate A. (2018) Primary and Secondary Diastolic Dysfunction in Heart Failure With Preserved Ejection Fraction. Am J Cardiol. Nov 1;122(9):1578-1587.
View at Publisher | View at Google Scholar - Gilman D. Plitt, Jordan T. Spring, Michael J. (2018) Moulton, Denendra K. Agrawal. Mechanisms, diagnosis, and treatment of heart failure with preserved ejection fraction and diastolic dysfunction. Expert Rev Cardiovasc Ther. August 16(8): 579–589.
View at Publisher | View at Google Scholar - Ovchinnikov A.G., Potekhina A.V., Ozherel'eva M.V., Ageev F.T. (2017) Left ventricular dysfunction in hypertensive heart: a modern view on pathogenesis and treatment. Cardiology. 57(S2), p. 367-382.
View at Publisher | View at Google Scholar - Dimov A.S., Leshchinsky L.A. (2005) Diagnosis of preclinical stages of chronic heart failure. Russian journal of cardiology. No. 5(55), p. 71-76.
View at Publisher | View at Google Scholar - van Riet EE, Hoes AW, Wagenaar KP, Limburg A, Landman MA, Rutten FH. (2016) Epidemiology of heart failure: the prevalence of heart failure and ventricular dysfunction in older adults over time. A systematic review. Eur J Heart Fail. Mar 18(3):242-52.
View at Publisher | View at Google Scholar - Kaw R, Hernandez AV, Pasupuleti V, Deshpande A, Nagarajan V, Bueno H, Coleman CI, Ioannidis JP, Bhatt DL, Blackstone EH; (2016) Cardiovascular Meta-analyses Research Group. Effect of diastolic dysfunction on postoperative outcomes after cardiovascular surgery: A systematic review and meta-analysis. Thorac Cardiovasc Surg. Oct;152(4):1142-53.
View at Publisher | View at Google Scholar - Moldotashev IK, Kudaibergenova NT, Osmonov DA et al. (2021) Echocardiographic predictors of early postoperative periods in patients after coronary artery bypass graft surgery. “Wiadomosci Lekarskie”, volume LXX1Y, Issue 3, Part 1, March, 395-398.
View at Publisher | View at Google Scholar - Osmonov DA, M. Unal., Moldotashev IK et al. Evaluation of complications predictors in the performance of coronary artery bypass graft in surgery in the cardiac surgery clinic “BICARD”. Cor et Vasa; 65:45-49.
View at Publisher | View at Google Scholar - Sharifov OF, Schiros CG, Aban I, Denney TS, Gupta H. (2016) Diagnostic Accuracy of Tissue Doppler Index E/e' for Evaluating Left Ventricular Filling Pressure and Diastolic Dysfunction/Heart Failure With Preserved Ejection Fraction: A Systematic Review and Meta- analysis. J Am Heart Assoc. Jan 25;5(1):e002530.
View at Publisher | View at Google Scholar - DeVore AD, McNulty S, Alenezi F, et al. (2017) Impaired left ventricular global longitudinal strain in patients with heart failure with preserved ejection fraction:insights from RELAX trial. Eur J Heart Fail. Jun; 19(7):893-900.
View at Publisher | View at Google Scholar - Taiki Chono, Keishi Ogura, Akiyoshi Hashimoto. (2015) Assessment of left ventricular systolic and diastolic function with retrospective electrocardiogram triggered 320-row area detector computed tomography: a comparison with ultrasound echocardiography. Nihon Hoshasen Gijutsu Gakkai Zasshi. Aug;71(8):685-90.
View at Publisher | View at Google Scholar - Smith OA. (2018) Evaluation of left ventricular diastolic function: state of the art after 35 years with Doppler assessment. J Echocardiogr. Jun;16(2):55-64.
View at Publisher | View at Google Scholar - Azarisman SM, Teo KS, Worthley MI, Worthley SG. (2017) Cardiac magnetic resonance assessment of diastolic dysfunction in acute coronary syndrome. J Int Med Res. Dec;45(6):1680-1692.
View at Publisher | View at Google Scholar - Mirjana M Platisa, Nicola N Radovanovic, Aleksandar Kalauzi et al. (2019) Differentiation of heart failure patients by the ratio of the scaling exponents of cardiac interbeat intervals. front Physiol. May 14; 10:570.
View at Publisher | View at Google Scholar - Holmqvist F, Platonov PG, Solomon SD, Petersson R, McNitt S, Carlson J, Zareba W, Moss AJ; MADIT-CRT Investigators. (2013) P-wave morphology is associated with echocardiographic response to cardiac resynchronization therapy in MADIT-CRT patients. Ann Noninvasive Electrocardiol. Nov;18(6):510-8.
View at Publisher | View at Google Scholar - Kuznetsova N.O., Sagirova Zh. N., Gubina A.Yu. (2022) Evaluation of myocardial function in patients with chronic heart failure using a single-channel electrocardiogram recorder. Bulletin of new medical technologies.Volume 29, No. 1, pp. 46-52.
View at Publisher | View at Google Scholar - Trubacheva E.A., Bogdanov Yu. A. (2022) Identification of signs of COVID-19 infection in the ECG by changes in the frequency spectrum in the basis of Laguerre polynomials. Bulletin of emergency and restorative medicine. Volume 2, No. 1. With. 61-78 ISSN: 2306-4110.
View at Publisher | View at Google Scholar
