

Research Article | DOI: https://doi.org/10.31579/2834-8664/039
Depression and Anemia
- Micha Milovanovic 1,2
1 Department of Internal Medicine, Vrinnevi Hospital, Norrköping, Sweden.
2 Department of Health, Medicine and Care (HMV), Faculty of Health Sciences, Linköping University, 581 85 Linköping, Sweden
*Corresponding Author: Micha Milovanovic, Department of Internal Medicine, Vrinnevi Hospital, Norrköping, Sweden
Citation: Micha Milovanovic, (2024), Depression and Anemia, International Journal of clinical and Medical Case Reports, 3(1); Doi:10.31579/2834-8664/039
Copyright: © 2024, Micha Milovanovic. This is an open-access article distributed under the terms of the Creative Commons Attribution License, which permits unrestricted use, distribution, and reproduction in any medium, provided the original author and source are credited.
Received: 04 January 2024 | Accepted: 19 January 2024 | Published: 29 January 2024
Keywords: anemia; depression; erythrocytes; hemoglobin
Abstract
Background: Depression exists in mild, moderate, and severe depressive attacks. Evidence suggests that depression is linked to anemia. Several studies have established a correlation between depression and anemia. In previous studies, a venous blood sample was normally used to analyze the average value of hemoglobinand parameters of erythrocytes. The current study examined full blood count (FBC) in different populations of erythrocytes in individuals with depression (DE) compared to a healthy control group (CON).
Material and Methods: All DE, n=24 were diagnosed with DSM-IV and ICD-10. CON, n=54 served as controls. A Percoll™ gradient was used to separate erythrocytes into different density fractions. In all fractions, FBC, i.e., red blood cell count (RBC), hemoglobin concentration (Hb), mean corpuscular hemoglobin (MCH), mean body hemoglobin concentration (MCHC) and mean body volume (MCV) were analyzed using a CELL-DYN 4000. As a comparison, a second blood sample was also taken, where the mean values of FBC were analyzed.
Results: When the mean value of FBC was analyzed, no significant difference was found between the groups. In contrast, when erythrocytes were separated by density, a lesser amount of Hb was found amongst the smaller erythrocytes, i.e. fractions nos. 8-17 (p < 0.05). No significant difference was found when measuring MCH and MCHC in the same density fractions.
Conclusion: The current study provides evidence that smaller erythrocytes that were divided by density have less hemoglobin. However, erythrocytes which were not separated by density i.e. mean values of hemoglobin showed no difference between the groups. For that reason, it may be of value to perform an extended analysis of erythrocytes and hemoglobin as a complement to the average value of hemoglobin. This may be of value when DE patients are investigated for anemia.
Introduction
Depression is a neurological condition that can be differed into severe, moderate, mild, and depressive episodes. The disease is common in several different populations, and the condition is more common in those suffering from chronic disease [1]. Several different studies confirm that depression is related to anemia [2-4]. However, a contrary notion exists, an earlier cohort study confirmed that no association exists between depressive disorders and hemoglobin levels or anemia status [2]. Another study showed that the connection with anemia is accounted for by physical health status and may mirror anemia of chronic disease [5]. Another additional study suggests that anemia is associated with depression in women but not in men [6].
Symptoms of low hemoglobin level (dizziness, fatigue, whiteness, shortness of breath during physical activity, higher heart rate at rest) also occur in depressive symptoms. A possible connection between low hemoglobin levels i.e. anemia and depression can probably be explained by an underlying poorer physical health status such as fatigue [7-9], lower levels of brain oxygen [10], deficiency of vitamin B12 [11] or elevated inflammatory levels [12-13]. However, previous studies show that depression may result in lower hemoglobin levels due to worse health behaviors, examples include malnutrition or high alcohol consumption [14-15]. The use of psychotropic treatments especially selective serotonin reuptake inhibitors (SSRIs) and serotonin-norepinephrine reuptake inhibitors (SNRIs) is connected to a higher risk of abnormal bleeding which could lead to anemia [16-17]. On the other hand, antidepressants may be able to decrease the risk of anemia by easing depressive symptoms and thereby improving health-related behaviors [14].
To our knowledge, previous studies regarding depression and anemia have focused on the analysis of whole blood, that is, a regular venous blood sample in which the average value of hemoglobin level and parameters of red blood cells have been analyzed. In this study, the aim was to analyze the full blood count in different populations of erythrocytes in individuals with major depression. These different population of red blood cells was then compared with the red blood cells of healthy participants in an adult population to determine whether depression is associated with anemia.
Material and Methods
Subjects
The current study included 24 patients with depression (DE), aged 50 ± 14 years (mean ± SD). Recruitment of patients took place in connection with care visits to the psychiatry clinic at the local hospital. All subjects included in the study were diagnosed with DSM-IV and ICD-10. As for DSM-IV, it is specifically described that the condition must have resulted in a change in the person's condition. The patients who verbally declined the study were excluded. The control group (CON) consisted of 54 healthy individuals aged 67 ± 4 years (mean + SD). All of the CON group were included in the study after requesting medical care at a nearby health center, all of whom were free of any depressive condition. Appropriate Ethics declarations are as follows: both patients and the control group gave informed consent. The study has been approved by the local ethics committee at Linköping University, Sweden (reg. number: 2012/269-32).
Laboratory Investigations
From each subject, two blood samples were taken from the antecubital vein. Vacutainer™ tubes (Becton and Dickinson, New Jersey, U.S.A.) were used for this purpose. The blood of the first tube, containing 7.5 ml was anticoagulated by adding 2.5 ml of antiplatelet solution. This mix where then poured into a 50 ml tube containing a linear Percoll™ (GE Healthcare Bio-Sciences AB, Sweden) gradient covering the density range of 1.04–1.09 kg L. The gradient tube was then used to separate erythrocytes by density. The procedure has been described previously [18-20]. Briefly, the gradient tube was centrifuged at 2767 g for 1.5 hours. Next, the bottom of the tube was perforated so that 2 ml gradient fractions could be poured by gravity into smaller test tubes. In each of these fractions a Full Blood Count (FBC), i.e., red blood cell count (RBC), hemoglobin (Hb) concentration, mean corpuscular hemoglobin (MCH), mean body hemoglobin concentration (MCHC) and mean body volume (MCV) were analyzed using a CELL-DYN 4000 (Abbott Diagnostics, Illinois, USA). The second tube, containing 3,5 ml venous blood anti-coagulated with NaEDTA was used to measure mean values of FBC.
Statistics
Microsoft Excel®, ver. 12.0.6514.5000 was used for the statistical calculations. The unpaired Student's t-test was used to estimate quantitative data. p-values ≤ 0.05 were used to specify significance
Results
The mean values of full blood count (FBC) between DE and CON are shown in table 1. There was no demonstrated difference between the groups.
Figure 1: The distribution of erythrocytes (x 1012/L) in the gradient for depression patients and controls. Fraction no. 1 detains erythrocytes having the highest density.
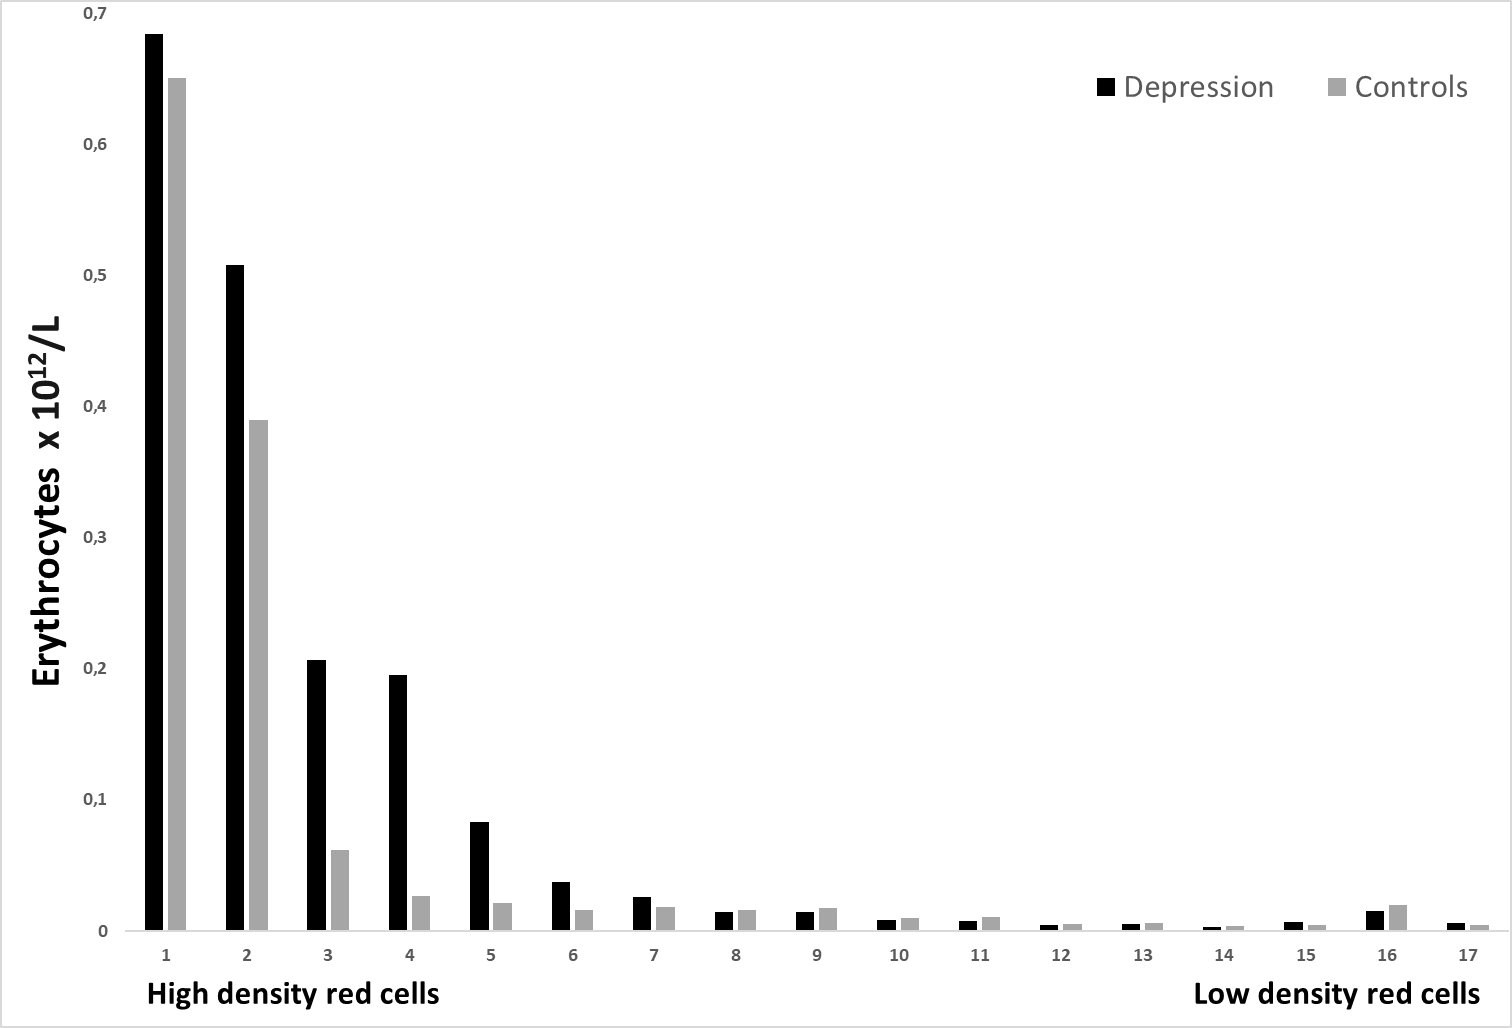
Figure 1: The distribution of erythrocytes (x 1012/L) in the gradient for depression patients and controls. Fraction no. 1 detains erythrocytes having the highest density.
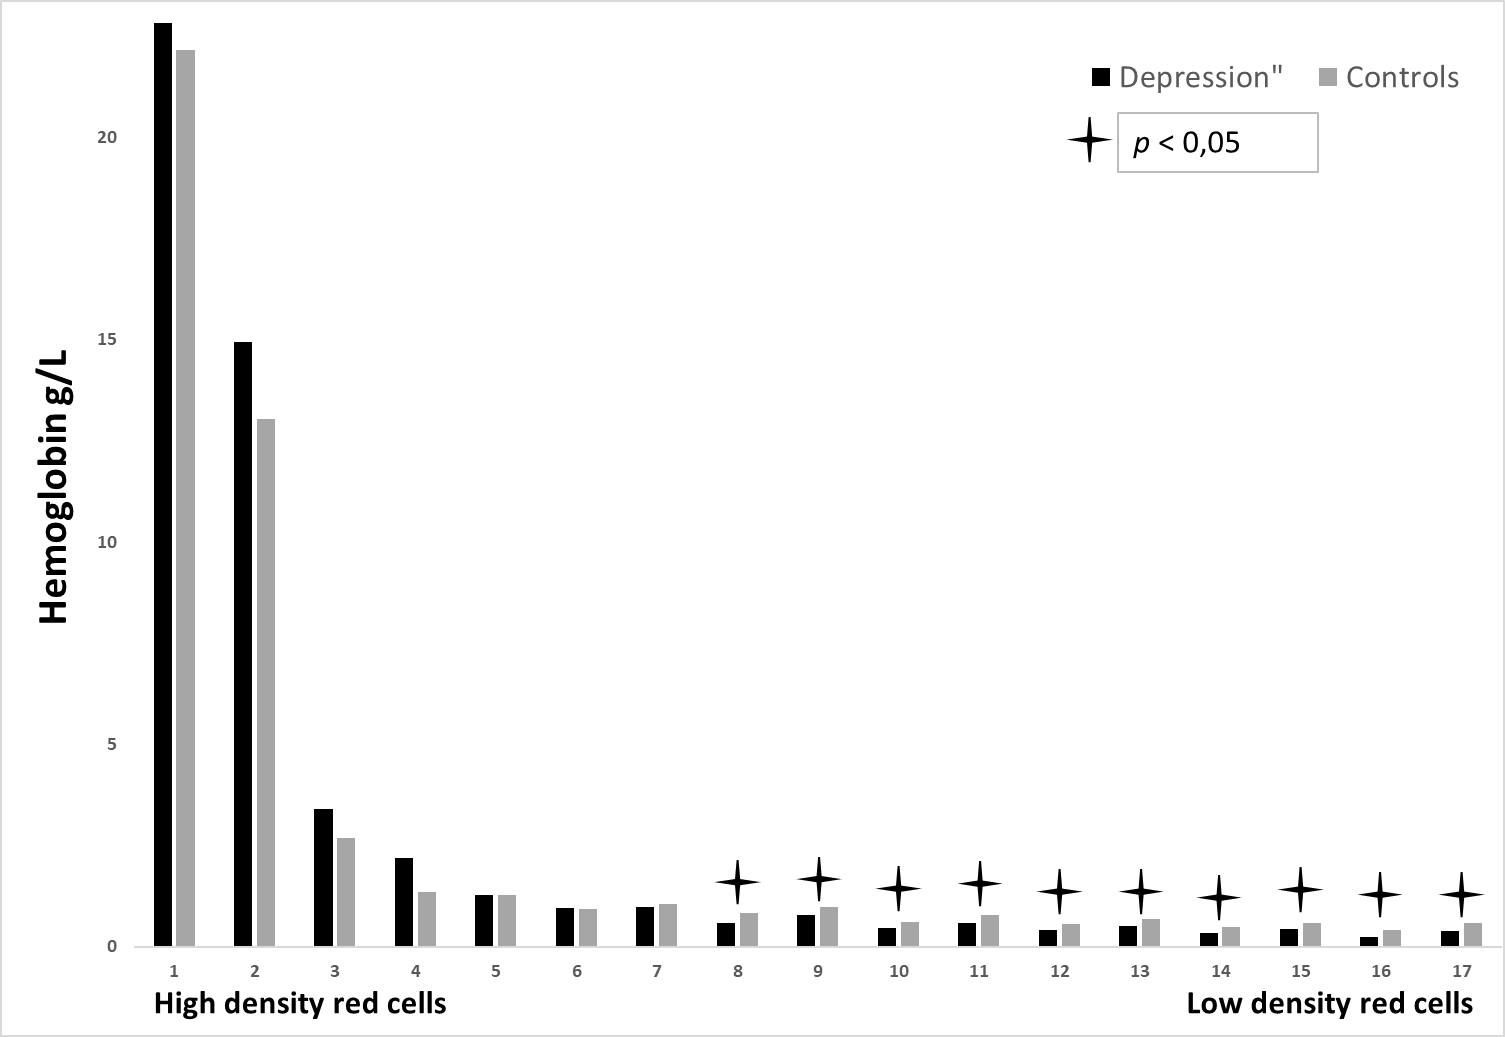
Figure 2: Illustrates Hb-concentration in matching 17 different density fractions, no significant difference was found in fractions nos. 1-7, fractions nos. 8-17, on the other hand, showed a significant difference, p<0>
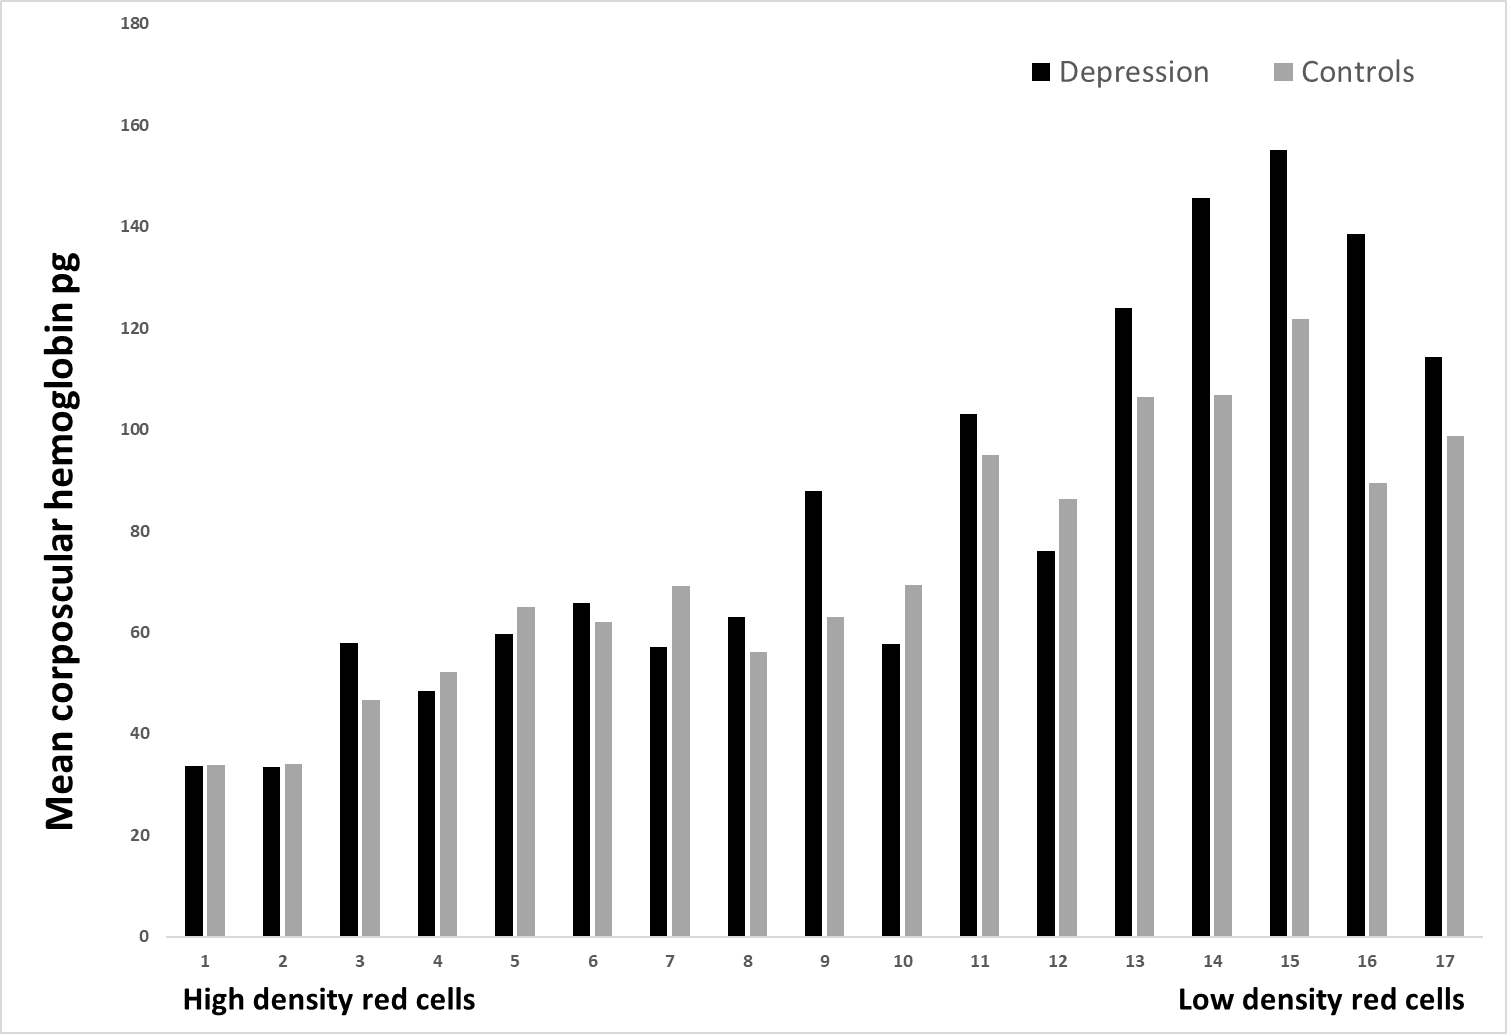
Figure 3: displays MCH measured in the same 17 different density fractions. Some of the fractions (fractions nos. 3, 9, and 12) showed a significant difference between the two groups, p < 0>
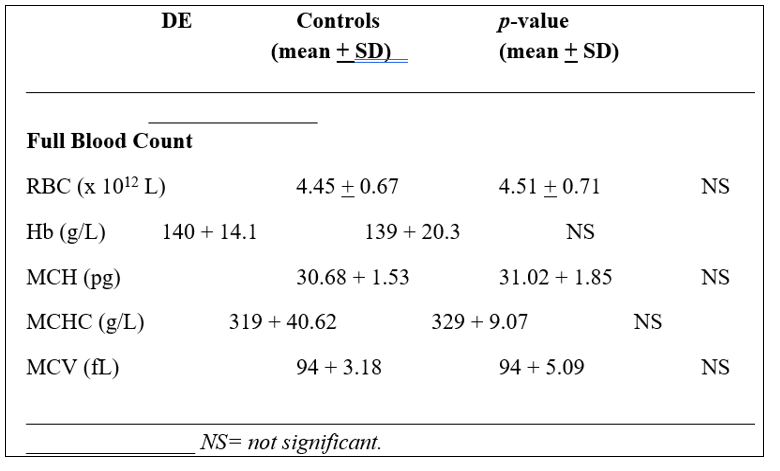
Table 1 shows the mean values of Full Blood Count (FBC) (n=24) between the Depression (DE) and Control group (CON) (n=54).
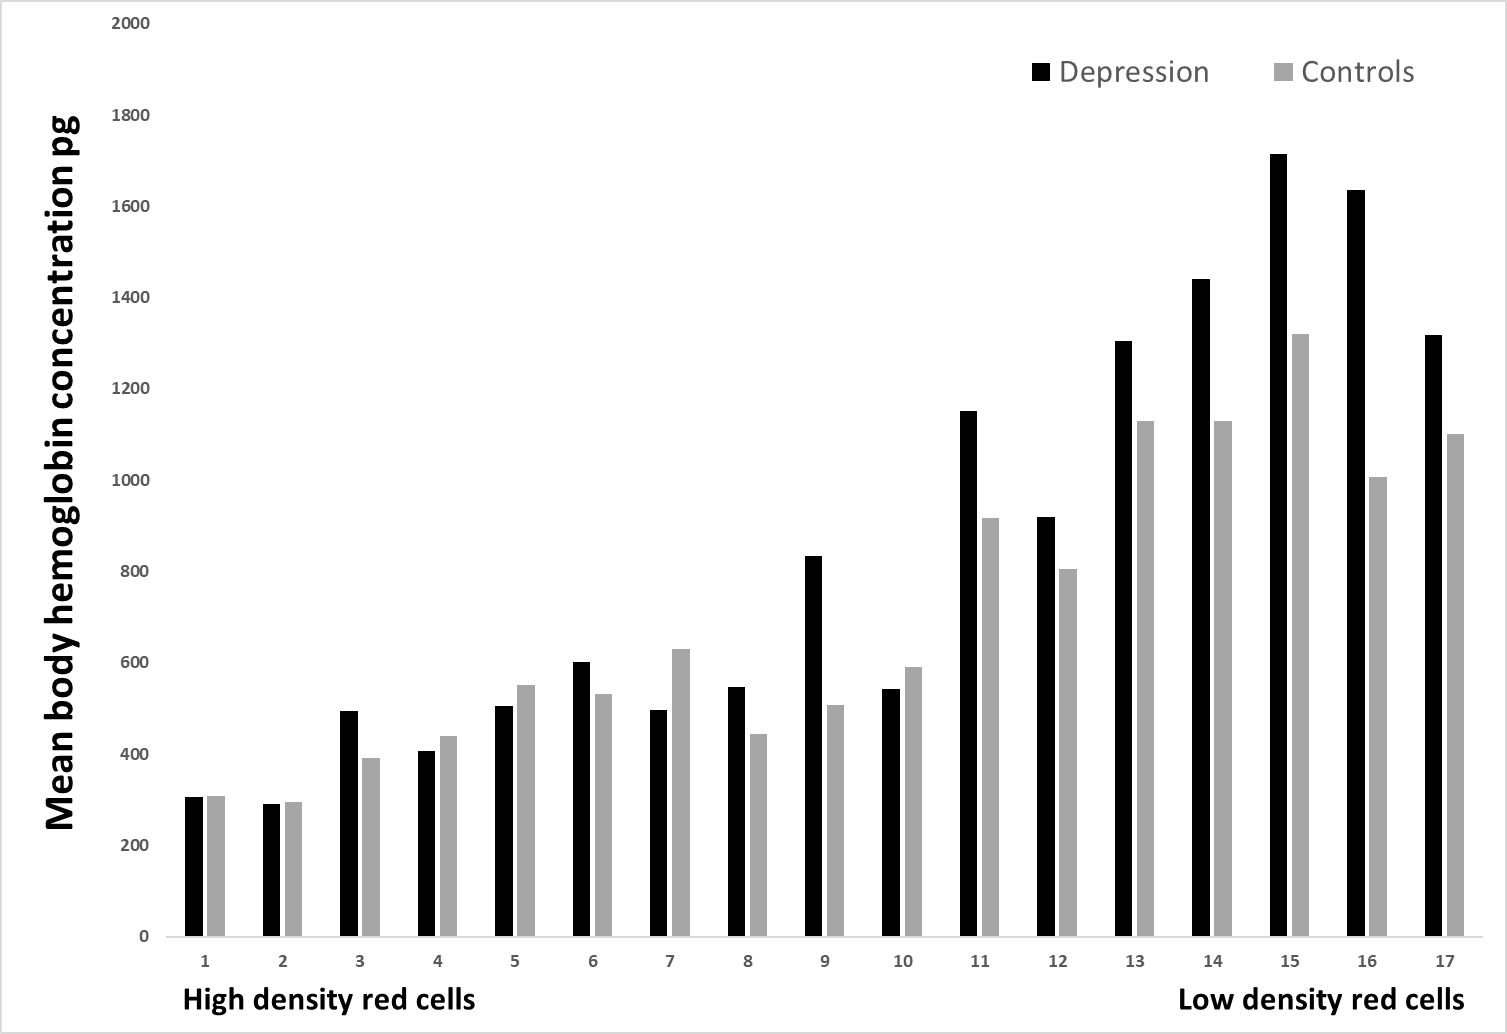
Figure 4: presents MCHC in identical17 different density fractions. Only fraction no. 9 exposed a significant difference between the two groups, p < 0>
Discussion
To present knowledge, this is to be the first description of studying different erythrocytes subpopulations in individuals with depression compared to a healthy control group. The current study shows that there is no significant difference when analyzing the mean values of FBC between the groups (table 1). In contrast, when the whole blood was separated by density and size, a significant difference was found when comparing Hb concentration in fractions nos. 8-17, i.e. these are the fractions where the smaller red cells were present (p<0>
The existing study thus displays significant differences when comparing the two study groups with respect to Hb concentration in the different red cell density fractions (figure no.2). However, this difference only exists in fraction no. 8-17, i.e. where the smaller erythrocytes were located. Previous research has shown that low hemoglobin levels (anemia) are related to depressive symptoms [21-23]. Such a connection is highly to be expected since symptoms of a low hemoglobin level (fatigue, dizziness, paleness, shortness of breath during physical activity, higher heart rate at rest) likewise often happen when having depressive (or anxiety) symptoms. The connection between low hemoglobin levels and depression could be explained by the fact that these individuals have a poorer physical health status where fatigue often is present [24-26]. On the contrary, higher hemoglobin levels were found in people with depressive and/or anxiety disorders. However, individuals with higher severity of depression showed both higher and lower hemoglobin levels. The conclusion of that study showed that no relationship existed between depression hemoglobin levels or anemia status [27]. Despite low hemoglobin levels, DE showed a normal MCH and MCHC. This suggests that mean values of FBC may not sufficient to be able to draw a conclusion about depression and anemia, i.e., Hb-concentration. The current study provides evidence that smaller erythrocytes from DE patients contain less hemoglobin. The study also revealed that there was no difference in the mean hemoglobin values of erythrocytes that were not separated by density. One can confirm that the current study thereby shows no clear evidence for an association between depression and low hemoglobin levels. Regardless, the current method shows that there may be value in examining erythrocytes and hemoglobin on a deeper level instead of analyzing an average value of hemoglobin. In particular, this may be of significance when DE patients are examined for anemia . The clinical implication of the monitored hemoglobin level heterogeneity remains however still uncertain; one cannot estimate the clinical significance of our results based on the present study. For this reason, larger studies of this subject are necessary to evaluate these questions. The current method used a continuous Percoll™ gradient with a density range from 1.04 to 1.09 kg/L to separate erythrocytes according to density. These gradients are more precise than discontinuous ones. After centrifugation, high-density red cells are located in the bottom of the test tube. From a technical point of view and in terms of reproducibility, the technique implemented in this study is an inferior alternative in comparison to the techniques used in various laboratories around the world. Many laboratories use a flow cytometric technique, which is superior to the one now described. However, there is a big advantage with this technology, i.e. the technique allows the red cells to be separated by density i.e. size. By using technique there is also an opportunity to analyze Hb-content in many different sizes of red cells. With a flow cytometric technique, only a general average value based on the body's red cells is provided
Statements & Declarations
Funding
Östergötland County Council made this work possible through its funding.
Conflict of Interest
We declare that no economic relationship exists that can be construed as a conflict of interest.
Ethics approval and Consent to Participate
The study has been approved by the local ethics committee at Linköping University, Sweden (reg. number: 2012/269-32). Informed consent was obtained from both patients and the control group.
Written Consent for Publication
Informed consent for publication was obtained from both patients and the control group. All information from patients was anonymized.
Availability of data and material
The datasets used and/or analyzed during the current study are available from the corresponding author upon reasonable request.
Code availability
Not applicable
Author Contribution
The author of the manuscript has carried out all steps for the current study.
Competing Interest
The authors declare that they have no competing interests.
Acknowledgements
Not applicable.
References
- Lopez AD, Mathers CD, Ezzati M, Jamison DT, Murray CJ.(2001). Global and regional burden of disease and risk factors: systematic analysis of population health data. Lancet 2006;367: 1747-1757.
View at Publisher | View at Google Scholar - Lever-van Milligen BA, Vogelzangs N, Smit JH, Penninx BW.(2014) Hemoglobin levels in persons with depressive and/or anxiety disorders. J Psychosom Res ;76:317-321.
View at Publisher | View at Google Scholar - Steptoe A, Wikman A, Molloy GJ, Kaski JC.(2012). Anaemia and the development of depressive symptoms following acute coronary syndrome: longitudinal clinical observational study. BMJ Open;2:e000551.
View at Publisher | View at Google Scholar - Stewart R, Hirani V.(2012).Relationship between depressive symptoms, anemia, and iron status in older residents from a national survey population. Psychosom Med;74:208-213.
View at Publisher | View at Google Scholar - Stewart R, Hirani V.(2012). Relationship between depressive symptoms, anemia, and iron status in older residents from a national survey population. Psychosom Med;74:208-213.
View at Publisher | View at Google Scholar - Park GN, Kim JO, Oh JW, Lee S.(2022). Association between anemia and depression: The 2014, 2016, and 2018 Korea National Health and Nutrition Examination Survey. J Affect Disord;1:312:86-91.
View at Publisher | View at Google Scholar - Cesari M, Penninx BW, Lauretani F, Russo CR, Carter C, et al.(2004). Hemoglobin levels and skeletal muscle: results from the InCHIANTI study. J Gerontol A Biol Sci Med Sci;59:249-254.
View at Publisher | View at Google Scholar - Chaves PH, Ashar B, Guralnik JM, Fried LP.(2002). Looking at the relationship between hemoglobin concentration and prevalent mobility difficulty in older women. Should the criteria currently used to define anemia in older people be reevaluated? J Am Geriatr Soc;50:1257-1264.
View at Publisher | View at Google Scholar - Penninx BW, Pahor M, Cesari M, Corsi AM, Woodman RC, et al.(2012) Anemia is associated with disability and decreased physical performance and muscle strength in the elderly. J Am Geriatr Soc;52:719-724.
View at Publisher | View at Google Scholar - Weiskopf RB, Feiner J, Hopf H, Lieberman J, Finlay HE,et al.(2006). Fresh blood and aged stored blood are equally efficacious in immediately reversing anemia-induced brain oxygenation deficits in humans. Anesthesiology;104:911-920.
View at Publisher | View at Google Scholar - Patel KV. (2008).Epidemiology of anemia in older adults. Semin Hematol;45:210-217.
View at Publisher | View at Google Scholar - Dowlati Y, Herrmann N, Swardfager W, Liu H, Sham L, Reim EK, et al.( 2010). A metaanalysis of cytokines in major depression. Biol Psychiatry;67:446-457.
View at Publisher | View at Google Scholar - Vogelzangs N, Beekman AT, De JP, Penninx BW.(2013). Anxiety disorders and inflammation in a large adult cohort. Transl Psychiatry;3:249.
View at Publisher | View at Google Scholar - Quirk SE, Williams LJ, O’Neil A, Pasco JA, Jacka FN,et al.(2013). The association between diet quality, dietary patterns and depression in adults: a systematic review. BMC Psychiatry;13:175.
View at Publisher | View at Google Scholar - Gaye B, Prugger C, Perier M.C, Thomas F, Plichart M, et al.(2016). High level of depressive symptoms as a barrier to reach an ideal cardiovascular health. The Paris prospective study III. Sci. Rep;6:18951.
View at Publisher | View at Google Scholar - Andrade C, Sandarsh S, Chethan KB, Nagesh KS.(2010). Serotonin reuptake inhibitor antidepressants and abnormal bleeding: a review for clinicians and a reconsideration of mechanisms. J Clin Psychiatry;71:1565-1575.
View at Publisher | View at Google Scholar - Lindqvist PG, Nasiell J, Gustafsson LL, Nordstrom L.(2014). Selective serotonin reuptake inhibitor use during pregnancy increases the risk of postpartum hemorrhage and anemia: a hospital-based cohort study. Thromb Haemost;12:1986-1992.
View at Publisher | View at Google Scholar - Milovanovic M, Lotfi K, Lindahl T, Hallert C, Järemo P. (2010).Platelet density distribution in essential thrombocythemia. Pathophysiol Haemost Thromb;37:35-42.
View at Publisher | View at Google Scholar - Milovanovic M, Lysen J, Ramström S, Lindahl TL, Richter A,et al.(2003).Identification of low-density platelet populations with increased reactivity and elevated alpha-granule content. Thromb Res;111:75-80.
View at Publisher | View at Google Scholar - Järemo P.(1995). Computerised method for recording platelet density distribution. Eur J Haematol ;54:304-309.
View at Publisher | View at Google Scholar - Stewart R, Hirani V.(2012).Relationship between depressive symptoms, anemia, and iron status in older residents from a national survey population. Psychosom Med;74:208-213.
View at Publisher | View at Google Scholar - Onder G, Penninx BW, Cesari M, Bandinelli S, Lauretani F, et al.(2005) Anemia is associated with depression in older adults: results from the InCHIANTI study. J Gerontol A Biol Sci Med Sci;60:1168-1172.
View at Publisher | View at Google Scholar - Hamer M, Molloy GJ.(2009). Cross-sectional and longitudinal associations between anemia and depressive symptoms in the English Longitudinal Study of Ageing. J Am Geriatr Soc;57:948-949.
View at Publisher | View at Google Scholar - Penninx BW, Pahor M, Cesari M, Corsi AM, Woodman RC, et al.(2004). Anemia is associated with disability and decreased physical performance and muscle strength in the elderly. J Am Geriatr Soc;52:719-724.
View at Publisher | View at Google Scholar - Cesari M, Penninx BW, Lauretani F, Russo CR, Carter C, et al.(2004). Hemoglobin levels and skeletal muscle: results from the InCHIANTI study. J Gerontol A Biol Sci Med Sci;59:249-254.
View at Publisher | View at Google Scholar - Chaves PH, Ashar B, Guralnik JM, Fried LP.(2002). Looking at the relationship between hemoglobin concentration and prevalent mobility difficulty in older women. Should the criteria currently used to define anemia in older people be reevaluated? J Am Geriatr Soc;50:1257-1264.
View at Publisher | View at Google Scholar - Lever-van Milligen BA, Vogelzangs N, Smit JH, Penninx BW.(2014). Hemoglobin levels in persons with depressive and/or anxiety disorders. J Psychosom Res;76:317-321.
View at Publisher | View at Google Scholar
