

Review Article | DOI: https://doi.org/10.31579/2835-9232/067
Autism Spectrum Disorder Diagnosing by Graph Theory Metrics
1Faculty of Electrical and Computer Engineering, University of Tabriz, Tabriz, Iran.
*Corresponding Author: Reza Solhivand, , Faculty of Electrical and Computer Engineering, University of Tabriz, Tabriz, Iran.
Citation: Reza Solhivand, Karim Abbasian, (2024), Retrospective comparative study of Dopaminergic Therapy’s efficacy’s persistence between a group of patients with Parkinson's Disease and a group with Vascular Parkinsonism, International Journal of Clinical Epidemiology, 3(4); DOI:10.31579/2835-9232/067
Copyright: © 2024, Reza Solhivand. This is an open-access article distributed under the terms of the Creative Commons Attribution License, which permits unrestricted use, distribution, and reproduction in any medium, provided the original author and source are credited.
Received: 18 May 2024 | Accepted: 18 June 2024 | Published: 16 July 2024
Keywords: asd fmri data; graphvar; dpabi; svm; functional connectivity network
Abstract
Autism Spectrum Disorder (ASD) as a condition with elusive neural underpinnings has been identified as a major psychiatric disorder. This study leverages resting-state fMRI (rs-fMRI) data from ASD individuals and typical controls (TC) to enhance diagnostic precision. Following some comprehensive preprocessing steps, the GraphVar toolbox was utilized for machine learning analysis and classification. The preprocessing steps covered fMRI data from 184 individuals (79 with ASD, 105 TC) via the dpabi toolbox. Among the subjects, only individuals with autistic disorder were chosen which comprised 50 autistic disorder patients and 50 typically developing controls. Subjects with other disorders such as Asperger’s syndrome, etc. were not included in this study. Region of interest (ROI) signals were extracted from preprocessed fMRI data and correlation matrices were calculated for each subject, serving as input for the GraphVar. The utilized approach achieved superior diagnostic accuracy compared to contemporary reports. By integrating Graph theory with GraphVar's machine-learning capabilities, up to 84% diverse diagnostic accuracies were achieved using eigenvector centrality graphs. The integration streamlines the ASD diagnosis process, enabling faster, and more precise assessments. Early diagnosis would potentially improve the quality of life for individuals with ASD.
Abbreviation
AAL: Automated Anatomical Labeling atlas
ABIDE: Autism Brain Imaging Data Exchange
ASD: Autism Spectrum Disorder
AUC: Area Under Curve
BMI: Body Mass Index
FIQ: Fibromyalgia Impact Questionnaire
FN: False Negative
FP: False Positive
MCC: Matthew’s Correlation Coefficient
PIQ: Performance Intelligence Quotient
PPV: Positive Predicted Value
ROI: Region Of Interest
Rs-fMRI: Resting-State Functional Magnetic Resonance Imaging
SPM: Statistical Parametric Mapping
SVM: Support Vector Machine
TC: Typical Controls
TN: True Negative
TNR: True Negative Rate
TP: True Positive
TPR: True Positive Rate
VIQ: Verbal Intelligence Quotient Introduction
Introduction
ASD as a neurodevelopmental disorder is characterized by persistent deficits in social communication and interaction and restricted and repetitive behaviors, interests, or activities [1-7]. It is known as a spectrum disorderbecause it presentsdifferently in each individual, with varying degrees of severity and a diverse array of symptoms. The ASD diagnosis typically needs a comprehensive assessment conducted by a multidisciplinary team of professionals, including clinical psychologists, developmental pediatricians, speechand language therapists, and maybe other specialists. The diagnostic process should comprise clinical evaluation, medical examination, standardized assessments, and screening for co-occurring conditions. The most important issue with ASD is early intervention for optimal outcomes [8]. A comprehensive and individualized approach for taking into account the unique characteristics of each person is also important to provide effective support and treatment. Researchers have increasingly turned to deep learning techniques to analyze and classify autismrs-fMRI data due to their ability to automatically extract detailed patterns and features for individual subjects from complex datasets. These approaches have shown promise in aiding the diagnosis and understanding of ASD. Various advanced neuroimaging and neurological data-gathering techniques have been utilized in the field of ASD research, encompassing structural and functional magnetic resonance imaging (fMRI), positron emission tomography (PET), electroencephalography (EEG), magnetoencephalography (MEG), and the other innovative protocols[8, 9]. Among these modalities, a substantial focus has been directed toward fMRI investigations, spanning both task-based (t-fMRI) and resting-state (rs-fMRI) fMRI data. Notably, public fMRI databases such as the ABIDE [10] have progressed over the years and today the datasets aggregate functional and structural brainimaging data from over 24 distinct independent sites, and this has led to an increase in international researchcollaborations [11]. Recently, SVM methodology has been employed extensively for the classification of rs-fMRI data in individuals diagnosed with ASD comparedto Typical Controls. Chen et al. appliedSVM to an fMRI dataset comprising 252 participants (126 ASD,126 TC) attaining a classification accuracy of 66% [12].Subsequently, Kassraian-Fard et al. performed classification on a datasetof
154 individuals (77 ASD, 77TC) achieving an accuracy of 63% [13].In a study by Zhao et al. involving a dataset with 100 subjects (54 ASD, 46 TC) the SVM method achieved an accuracy of 81% in distinguishing between ASD patients and controls [14]. Further investigations continued to underscore the utility of SVM in this domain. Bhaumik et al. conducted a study using a largergroup of 372 participants (167 ASD, 205 TC) yieldinga classification accuracyof 70% [15]. In subsequent work, Kazeminejad et al. reported an accuracy of 80% using SVM on a dataset comprising 137 individuals [16]. The trend of impressive classification accuracyusing SVM persisted in later research endeavors. Zhao et al. analyzed a dataset containing 92 subjects (45 ASD, 47 TC) and achieved an accuracy of 83% in distinguishing between ASD patients and typical controls [17].
“GraphVar” has been introduced as a user-friendly graphical-user-interface based toolbox (MATLAB) for brain connectivity, including network construction and characterization, statistical analysis (GLM and Machine Learning) on network topological measures, and interactive exploration of results analyzing comprehensively. It integrates features across multiple current toolboxes, such as the Brain Connectivity Toolbox, Network-Based Statistic Toolbox, BRAPH, and BrainNetClass [18, 19]. The GraphVar toolbox is so easy that does not require any coding for machine learning analysis making it a convenient tool for a wide range of users. In this work, the main objectivewas to present an easy-to-use machine learning classifier model that can help with ASD diagnosis in clinical applications. For this purpose, we present a pioneering utilization of GraphVar's machine learningcapabilities which includeSVM and ElasticNet methods in the fieldof ASD research. Our study marksthe application of GraphVar's advancedmachine-learning techniques to classify fMRI data derived from individuals with ASD and matched TC subjects. Furthermore, our investigation extends beyond mere classification by harnessing GraphVar's capabilities to generate complicated networks for each subject utilizing graph theory representations using complex neuro connectivity patterns inherent in the fMRI data. Central to our methodology is the employment of an SVM algorithm integrated within the GraphVar framework to discern distinctive neural signature characteristics of ASD and TC subjects. By using this innovative approach, we tried to enhance the accuracy and specificity of classification, potentially unveiling subtle differentiators concealed within the neuroimaging data. This study encompasses a comprehensive comparative analysis by applying principles of graph theory for network construction, comparing the outcomes derived from GraphVar's machine learning-driven classification with traditional methods. This approach provides a thorough evaluation of GraphVar's efficacy, offering insights into its potential as a transformative tool in neuroimaging-based disorder classification. In prior research, the GraphVar toolbox has been used to investigate various aspects of functional brain network connectivity and topology across a range of neuropsychiatric disorders. However, notably absent from its application is the domain of ASD diagnosis and modeling. For instance, Rikandiet al. explored functional networkconnectivity and topologyin psychosis, shedding light on the irregularities present in the network organization of individuals affectedby this condition [20]. Dacosta-Aguayo et al. employed GraphVar to analyze rs-fMRI data in patients with post-COVID-19 cognitive disorders [21].Similarly, Nestor et al. investigated abnormal brain networksin stimulant use disorder using GraphVar, contributing to our understanding of the neuralsubstrates underlying this addiction [22]. Furthermore, Zhu et al. examined the altered topological properties of brain functional networksin drug-resistant epilepsypatients through the lens of GraphVar [23].Weiler et al. explored the relationship between cognitive reserve and network topologyin Alzheimer's diseasepatients, highlighting the potential of GraphVar to uncover nuanced connectivity patterns associated with cognitive function[24]. Walteret al. delved into the realm oftranslational machine learning for psychiatric neuroimaging, underscoring GraphVar's versatility in capturing complex network dynamics[25]. Yang et al. investigated topological disruptions in whole-brain networks among childhood absence epilepsy patients,underscoring GraphVar's utilityin multimodal EEG-fMRIstudies [26].
In the following sections, we describethe steps takenin acquiring, preprocessing, and analyzing data then we will share the results and discuss them.
- Methodology
Rs-fMRI data used in the study was procured from the ABIDE (Autism Brain Imaging Data Exchange) database, specifically from the NYU Langone Medical Center. The dataset encompassed fMRI images from a cohortof 184 individuals, comprising 79 patients diagnosed with ASD and 105 typically developing controls. among the 79 ASD patients, there were subjects diagnosed with Asperger’s syndrome, pervasive developmental disorder,and autistic disorder.We focused on autistic disorderpatients that were 50 subjects and 50 typically developing controls, which were chosen in accordance.
- fMRI image preprocessing
The initial phase of the research centered on data preprocessing, an essential step due to the inherent presence of noise and commonartifacts within fMRI data. To address the presented challenges in the process,the dpabi [27, 28] toolbox was utilized, an established computational resourcegrounded in the principles of the SPM framework [29, 30].
Anatomical Scan | Number of slabs | 1 |
Slices per slab | 128 | |
Slice thickness | 1.33 mm | |
TR | 2530 ms | |
TE | 3.25 ms | |
Filter | Raw filter | |
Functional scan | Slice group | 1 |
Number of slices | 33 | |
Slice thickness | 4 mm | |
TR | 2000 ms | |
TE | 15 ms | |
Filter | None |
Table 1: Scan parameters
Firstly, slice timing correction was executed on the rs-fMRI data to correct timing differences introduced during slice acquisition. Then realignment techniques were applied to mitigate motion-related artifacts, especially important in longitudinal rs-fMRI studies. Subsequently, spatial normalization was employed to facilitate cross-subject comparisons, aligning the fMRI data with a standard reference space. Gaussian spatial smoothing was applied to the normalized data, with a Full Width at Half Maximum (FWHM) of [6 6 6]. This step aimed to enhance the signal-to-noise ratio and aid in subsequent analysis. After that, detrending was implemented to remove low-frequency drifts and artifacts, contributing to improved data quality. Band-pass filtering was then applied to confine the analysis to frequencies relevant to resting-state neural oscillations, specifically between 0.01 and 0.1 Hz. This comprehensive preprocessing approach aimed to ensure the reliability and quality of the fMRI data for our subsequent analysis and interpretation.
2.2 ROI signal extraction
ROI signals were carefully extracted for each individual, after the comprehensive preprocessing steps. Correlation matrices were computed from the extracted signals, a step achievable through both the dpabi toolbox and the GraphVar toolbox. However, the dpabi toolbox was specifically employed for this study. Each matrix serves as a distinct representation of functional connectivity patterns for an individual subject. Figure 1 represents functional connectivity patterns for a typical subject.
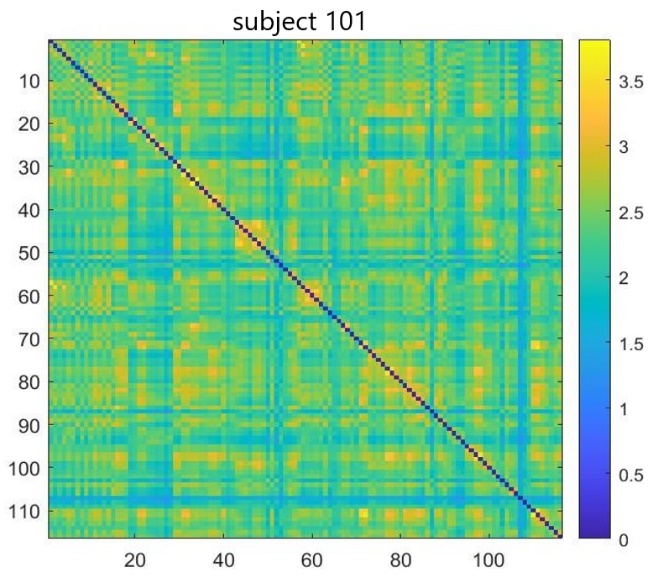
Figure 1. Functional connectivity matrix for a TC subject with 116 regions of interest on both the x and y axes, illustrating the interconnectivity between the regions in terms of functional connectivity strength
In Figure 1, the x and y axes demonstrate 116 brain regions based on the AAL atlas and connectivity between the ROIs (For this illustration, the connectivity matrices were Z-transformed (based on mean and standard deviation over all of the elementsof the matrix using equation 1.) [31].

(1)
Where r is the correlation coefficient.
2.3 Machine learning based classification
The correlation matrices, serving as comprehensive descriptors of functional connectivity, were used as inputs for following machine learning analysis. Upon successful completion of the comprehensive preprocessing pipeline, as outlined in the previous section, we transitioned into the pivotalphase of the research applyingadvanced machine learningmethodologies to examine the complex functional connectivity features inherent within the preprocessed rs-fMRI data and extract them for classification purposes. To achieve this, the SVM algorithm, embedded within the GraphVar framework was used. Within the GraphVar environment, a pivotal procedural sequence started by selecting anatomical brainregions, effectively establishing the framework for analysis. Herein, we employed the AAL atlas [32] encompassing a carefully curatedcollection of 116 individual brain regions. This atlas was thoughtfully chosen to afford a comprehensive representation of the neural landscape, ensuring that no vital connectivity aspects were overlooked. The subsequent step involved the calibration of parameters governing the construction of functional connectivity networks. One of the crucial decisions involved choosing how to set the threshold and its range, as it greatly influences the strength of connections in the network. negative connections were intentionally left out in this study because negative functional connectivity is challenging to interpret biologically. Positive connectivity typically represents synchronous neural activity, indicating regions that tend to activate together. Negative connectivity may suggest an anti-correlated activity, but its biological meaning is less clear, also negative connectivity can arise from various sources, including noise, artifacts, or physiological fluctuations. Distinguishing true negative connectivity from these sources can be methodologically challenging so a relative threshold spanning from 0.1 to 0.5 was established. With the networkconstruction parameters carefully set, we turned our focus to graph theory, using Graph Var to simultaneously explore both the theoretical aspects of graphs and the machine learning task at hand. This integrated approach allowed us to seamlessly combine a detailed understanding of graph properties with our machine-learning goal, enhancing the depth and comprehensiveness of our research. In this specific study, we employed the SVM (Support vector machine) probabilistic classification method. Renowned for its ability to discern complex patterns within datasets, the SVM algorithm proved to be an optimal choice for effectively categorizing our data into distinct classes, distinguishing between ASD patients and TC. During this stage, various parameters were extracted from the phenotypic file accompanying the dataset. Factors such as age, sex, BMI, FIQ (Full IQ), VIQ (Verbal IQ), and PIQ (Performance IQ) for each subject were included as variables in the classifier. This incorporation allowed us to assess the potential impact of these variables on the model's performance. After this step, an advanced nested cross-validation methodology has been employed within the GraphVar ML framework. This three-step structure for the validation of prediction models encompasses an outer loop designated for final validation, an optionally implemented middle loop for the optimization of hyperparameters, and an additional inner loop for feature selection. The implementation of this nested cross-validation paradigm necessitates extra data partitioning, where a subset of the training data is used at lower hierarchical tiers. After each hierarchical level, the parameters derived from the optimal model are circulated to higher tiers, activating a recursive process that enhances the model selection procedure. To assess the predictive performance of a trained prediction model, it is essential to evaluate the model on new, unseen data through a validation process.A common approachin machine learningis to reserve a portion of the available data as a test set to estimate the expected out-of-sample model performance. However, this data partitioning reduces the sample size for training,which can lead to two challenges, potential loss of criticaldata patterns and introducing dependency on a specific random choice for the train-test split. To address these limitations, K-fold cross-validation is frequently used. It dividesthe entire dataset into K subsets, repeating the holdout process K times. In each iteration, one of the K subsets serves as the test set, while the remaining K-1 subsets form the training set. The resulting predictions are then averaged across all K iterations to assess the overall model performance. The choice of K in K-fold cross-validation involves a trade-off between bias and variance, with lower K values being computationally efficient but potentially introducing more bias and less variance, while higher K values are computationally expensive and may introduce more variance and less bias.
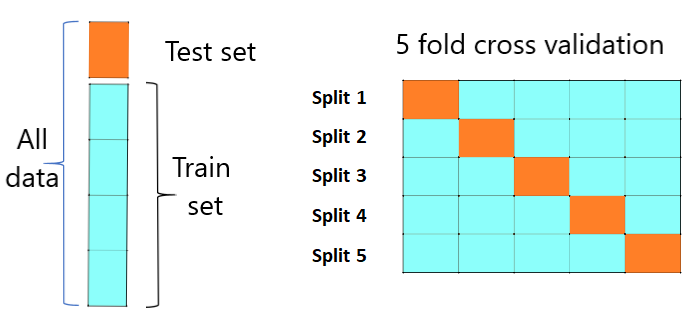
Figure 2. 5-fold cross-validation diagram
our cross-validation configuration consisted of a 5-step cross-validation process, a 5-step hyperparameter optimization phase, and a feature selection threshold set at 0.5. Furthermore, within GraphVar ML,feature scaling is performed individually within each test and train split, ensuring that the scaling applied to the training set is replicated on the test set within each fold. This precise approach helps prevent data leakage, where the predictive model unintentionally derives information from the unseen or holdout data, thereby preserving the integrity of estimated prediction performance.
Results
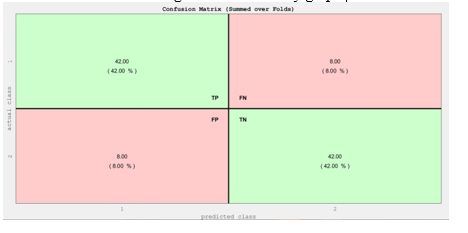
Figure 3. The confusion matrix of SVM probabilistic classification and eigenvector centrality graph. The matrix includes true positives (TP), false negatives (FN), false positives (FP), and true negatives (TN) as crucial components with the values 42%, 8%, 8%, and 42%, respectively.
Following the execution of preprocessing procedures on fMRI data, ROI signals were extracted from the data. Subsequently, correlation matrices were computed based on these ROI signals for each subject. These correlation matrices were then employed as the primary input for the
machine learning model, facilitating the investigation of dynamic functional connectivity patterns within the fMRI data. In the execution of the machine learning analysis, diverse graph-based measures were used to derive insights and classify data, embodying a comprehensive exploration of network attributes about the classification task. After model execution, a comparative analysis of results across different graph configurations ensued, facilitating the identification of the most effective approach. This model integrated an array of graph-based metrics encompassing assortativity, eigenvector centrality, graph radius, graph diameter, betweenness centrality, local and global characteristic path lengths, cluster coefficient, cost efficiency, degree distribution, density, small-world characteristics, positive strength, Shannon entropy-based diversity coefficient, path transitivity, and participation coefficient. The outcomesof the comparison are documented in Table 2, providing a comprehensive presentation of the performance yielded by each distinct graph configuration. Figure 3 displays the confusion matrix belonging to the highest accuracy achieved in classification tasks using SVM probabilistic classification and eigenvector centrality graph.
These metrics delineate the outcomes of the model's predictive capabilities within a binary classification framework. True positives represent 42 instances in which the model correctly identified as the positive class. False negatives, on the other hand, denote8 instances that the model failed to recognize. False positives signify8 instances in which the model incorrectly predicted the positiveclass. Lastly, True negatives encompass 42 instances that accurately identified the negative class.
To quantitatively assess the model'soverall accuracy, the standard formulafor accuracy was employed: Accuracy = (TP + TN) / (TP + TN + FP + FN) ×100% (2)
Substituting the provided values into equation (2), 84% classification accuracy was obtained. Nevertheless, it is imperative to recognizethat while accuracyoffers a valuableperformance metric, it is equallyessential to consider additional evaluation criteria such as precision, recall, and sensitivity, or align the assessment with the specific objectives of the model to attain a comprehensive appraisal of its efficiency which is demonstrated in table 2.
| Accuracy | PPV Prec. | TPR Sens. | TNR Spec. |
Assortativity | 81% | 84.4% | 76% | 86% |
Betweenness centrality | 63% | 60% | 78% | 48% |
Characteristic path length local | 72% | 70.4% | 76% | 68% |
Characteristic path length global | 82% | 82% | 82% | 82% |
Cluster coefficient | 81% | 81.6% | 80% | 82% |
Degree | 72% | 70.4% | 76% | 68% |
Density | 80% | 81.2% | 78% | 82% |
Eigenvector Centrality | 84% | 84% | 84% | 84% |
Graph diameter | 81% | 84.4% | 76% | 86% |
Graph radius | 83% | 82.4% | 84% | 82% |
participation coefficient | 77% | 78.7% | 74% | 80% |
cost efficiency | 80% | 82.6% | 76% | 84% |
Small world | 80% | 81.2% | 78% | 82% |
Path transitivity | 67% | 65.5% | 72% | 62% |
Strength Positive | 81% | 81.6% | 80% | 82% |
Shannon entropy- based diversity coefficient |
77% |
76.5% |
78% |
76% |
Table 2. Classification results with differentgraphs(PPV: positive predictive value (Precision), TPR: true positive rate (Sensitivity)
TNR: true negative rate (Specificity))
Table 3 includes additional metrics, namely threshold, F1 score (the mean of precision and recall), AUC (Area Under the Curve), and MCC (Matthew's Correlation Coefficient), specifically for graphs with a higher than 80?curacy.
| Threshold | F1 | AUC | MCC |
Assortativity | 0.1 | 0.8 | 0.87 | 0.623 |
Characteristic path length global | 0.5 | 0.82 | 0.876 | 0.64 |
Cluster coefficient | 0.49 | 0.808 | 0.864 | 0.62 |
Density | 0.49 | 0.796 | 0.846 | 0.6 |
Eigenvector Centrality | 0.24 | 0.84 | 0.885 | 0.68 |
Graph diameter | 0.42 | 0.8 | 0.86 | 0.623 |
Graph radius | 0.1 | 0.832 | 0.878 | 0.66 |
cost efficiency | 0.45 | 0.792 | 0.88 | 0.602 |
Small world | 0.45 | 0.796 | 0.863 | 0.6 |
Strength Positive | 0.37 | 0.808 | 0.841 | 0.62 |
Table 3. Threshold, F1, AUC, MCC values
Discussion
As presented in Table 2, our analysis achieved a notably high classification accuracy, prominently demonstrated by the eigenvector centrality metric attaining an impressive 84?curacy. The achievement stands in stark contrast to prior investigations utilizing the similar classification methodology and dataset, thus underscoring the advancements realized in the study. Following closely in the second position, the proposed model groundedin the graph radius metric exhibited an appreciable accuracyof 83%, substantiating the robustness and efficacy of this approach. In Table 4, we undertake a comparative analysisof the obtained findingsto compare them with the state-of-the-art studies. As demonstrated, the proposed method, despite its exclusion of complex coding procedures, has successfully attained superior classification accuracy in contrastto preceding investigations employing analogous data and classification techniques.
Studies | Accuracy | Classification method | Brain Atlas | Dataset | Participants |
Kassraian-Fard et al. [13] | 63% | SVM | CC200 | ABIDE | 77 ASD 77 TC |
Plitt et al. [33] | 76.67% | scikit-learn library | Destrieux Power DiMartino | rs-fMRI data | 59 ASD 59 TC |
Yang et al. [34] | 77.74% | 3D CNN | 8 functional connectivity networks from group-ICA | ABIDE | 79 ASD
105 TC |
Kazeminejad et al. [16] | 80% | Gaussian SVM | AAL116 | ABIDE | 137 (ASD&TC) |
Zhao et al. [14] 2018 | 81% | multiplelinear SVMs | Multi-level, high-order FCs | ABIDE | 54 ASD 46 TC |
Zhao et al. [17] 2020 | 83% | Linear-SVM | AAL116 | ABIDE | 45 ASD 47 TC |
The proposed model | 84% | SVM probabilistic classification | AAL116 | ABIDE | 50 ASD 50TC |
Table 4. Comparison of obtained resultswith the state-of-the-art studies
In the ASD classification literature, Kassraian-Fard et al. employed a Support Vector Machine with an accuracy of 63%. They utilized the CC200 brain atlas and the ABIDE dataset, involving 77 individuals with ASD and 77 typically developing (TC) participants. Another notable study by Plitt et al. achieved an accuracy of 76.67% using the scikit-learn library. Their approach involved brain atlases from Destrieux and Power DiMartino, utilizing rs-fMRI data. The dataset comprised 59 ASD and 59 TC individuals. Yang et al. took a different approach, employing a 3D Convolutional Neural Network (CNN) to achieve an accuracy of 77.74%. They utilized eight functional connectivity networks derived from group-ICA and the ABIDE dataset, with 79 ASD participants and 105 TC individuals. Kazeminejad et al. opted for a Gaussian SVM, attaining an 80?curacy. Their study used the AAL116 brain atlas and the ABIDE dataset, incorporating 137 individuals, including both ASD and TC participants. In 2018, Zhao et al. achieved an 81?curacy using multiple linear SVMs. Their study involved a brain atlas based on multi-level, high-order functional connections, and the ABIDE dataset with 54 ASD and 46 TC participants. Zhao et al. in 2020 improved accuracy to 83% with a Linear-SVM approach. The AAL116 brain atlas and the ABIDE dataset were utilized, involving 45 individuals with ASD and 47 TC participants. As one can see, the ABIDE dataset on AAL116 brain atlas with different SVM utilizing were introduced as common approach in this field of research. However, in this work the GraphVar integrated SVM with Graph theory without extra computation were used. Also, the proposed model demonstrated promising results with an accuracy of 84%, where SVM with probabilistic classification with different graphs to enhance classification accuracy were used.
By the way, the study has a couple of limitations that need to be acknowledged. Firstly, the utilization of GraphVar was constrained by its
limited incorporation of machine learning algorithms, which may restrict the exploration of diverse analytical approaches. Then in future, one should enhance methodological flexibility and deepen the understanding of the data. Secondly, the study acknowledges a constraint in the number of subjects included, which may limit the accuracy in ?. A larger and more diverse dataset may potentially enhance and yield more robust results, providing a clearer picture of the patterns and relationships under investigation. Consequently, future endeavors should aim to broaden the participant pool to achieve greater statistical power and generalizability. Furthermore, the study anticipates that with the integration of additional machine learning algorithms into the GraphVar framework. Then the research can be replicated and extended, fostering a more comprehensive and nuanced understanding of the underlying patterns in the data.
Conclusion
In summary,the investigation demonstrated the efficacy of GraphVar as a proficient tool for executing machine learning and statistical analysis on cerebral datasets.Within the contextof the paper, this toolbox was used to effectively conduct the classification of ASD data. SVM probabilistic classification was employed in conjunction with diverse graph metrics to classify data of ASD patients and typical control.Notably, our efforts yielded commendable outcomes, with the most noteworthy performance achieved through the utilization of eigenvector centrality graphs, attaining an accuracy rate of 84%. Looking forward, the integration of this particular graph construct holds promise for enhancing classification outcomes across various machine learning methodologies, affording the potential for heightened precision and more favorable outcomes. In the future by integration of easy-to-use machine learning tools such as GraphVar in clinical settings alongside traditional methods used for ASD diagnosis, the diagnostic process could be much faster and more accurate which helps physicians start the treatment process way fasterand achieve betterresults increasing quality of life in people with ASD.
Acknowledgement
This study received no financial support.
The authors of this paper like to declare that they do not have any conflict of interests
Link to the dataset used in this paper:
https://fcon_1000.projects.nitrc.org/indi/abide/abide_I.html
Contributions
Dr. Abbasian planned and supervised the project on the other hand writing and execution of machine learning classification was done by Reza Solhivand.
References
- Hull, L., Petrides, K. V., Allison, C., Smith, P., Baron-Cohen, S., Lai, M.-C., & Mandy, W. (2017).
View at Publisher | View at Google Scholar - Anita Vikram Shinde, Dipti Durgesh Patil, (2023), A Multi-Classifier-Based Recommender System for Early Autism Spectrum Disorder Detection using Machine Learning, Healthcare Analytics, Volume 4, 100211, ISSN 2772-4425,
View at Publisher | View at Google Scholar - Talukdar, J., Gogoi, D. K., & Singh, T. P. (2023). A comparative assessment of most widely used machine learning classifiers for analyzing and classifying autism spectrum disorder in toddlers and adolescents. Healthcare Analytics, 3, 100178.
View at Publisher | View at Google Scholar - Kalra, R., Gupta, M., & Sharma, P. (2023). Recent advancement in interventions for autism spectrum disorder: A review. Journal of Neurorestoratology, 11(3), 100068.
View at Publisher | View at Google Scholar - Yang, B., Wang, M., Zhou, W., Wang, X., Chen, S., Yuan, L.-X., & Dong, G.-H. (2023). Edge-centric functional network analyses reveal disrupted network configuration in autism spectrum disorder. Journal of Affective Disorders, 336, 74-80.
View at Publisher | View at Google Scholar - Dominguez-Alonso, S., Carracedo, A., & Rodriguez-Fontenla, C. (2023). The non-coding genome in autism spectrum disorders. European Journal of Medical Genetics, 66(6), 104752.
View at Publisher | View at Google Scholar - Ramachandran, V. S., & Oberman, L. M. (2006). Broken mirrors: A theory of autism. Scientific American, 295(5), 62-69.
View at Publisher | View at Google Scholar - St John, T., Dawson, G., & Estes, A. (2018). Brief Report: Executive Function as a Predictor of Academic Achievement in School-Aged Children with ASD. Journal of autism and developmental disorders, 48(1), 276-283.
View at Publisher | View at Google Scholar - Craig, F., Fanizza, I., Russo, L., Lucarelli, E., Alessandro, L., Pasca, M. G., & Trabacca, A. (2017). Social communication in children with autism spectrum disorder (ASD): Correlation between DSM-5 and autism classification system of functioning-social communication (ACSF: SC). Autism Research: Official Journal of the International Society for Autism Research, 10(7), 1249-1258.
View at Publisher | View at Google Scholar - Di Martino, A., Yan, C. G., Li, Q., Denio, E., Castellanos, F. X., Alaerts, K., ... & Milham, M. P. (2014). The autism brain imaging data exchange: Towards a large-scale evaluation of the intrinsic brain architecture in autism. Molecular Psychiatry, 19(6), 659-667.
View at Publisher | View at Google Scholar - Liu, M., Li, B., & Hu, D. (2021). Autism Spectrum Disorder Studies Using fMRI Data and Machine Learning: A Review. Frontiers in Neuroscience, 15.
View at Publisher | View at Google Scholar - Chen, C. P., Keown, C. L., Jahedi, A., Nair, A., Pflieger, M. E., Bailey, B. A., & Müller, R. A. (2015). Diagnostic classification of intrinsic functional connectivity highlights somatosensory, default mode, and visual regions in autism. NeuroImage: Clinical, 8, 238-245.
View at Publisher | View at Google Scholar - Kassraian-Fard, P., Matthis, C., Balsters, J. H., Maathuis, M. H., & Wenderoth, N. (2016). Promises, Pitfalls, and Basic Guidelines for Applying Machine Learning Classifiers to Psychiatric Imaging Data, with Autism as an Example. Frontiers in Psychiatry, 7, 177.
View at Publisher | View at Google Scholar - Zhao, F., Zhang, H., Rekik, I., An, Z., & Shen, D. (2018). Diagnosis of Autism Spectrum Disorders Using Multi-level High-Order Functional Networks Derived From Resting-State Functional MRI. Frontiers in Human Neuroscience, 12, 184.
View at Publisher | View at Google Scholar - Bhaumik, R., Pradhan, A., Das, S., & Bhaumik, D. K. (2018). Predicting autism spectrum disorder using domain-adaptive cross-site evaluation. Neuroinformatics, 16, 197-205.
View at Publisher | View at Google Scholar - Kazeminejad, A., & Sotero, R. C. (2019). Topological properties of resting state fMRI functional networks improve machine learning-based autism classification. Frontiers in Neuroscience, 12, 1018.
View at Publisher | View at Google Scholar - Zhao, F., Chen, Z., Rekik, I., Lee, S.-W., & Shen, D. (2020). Diagnosis of autism spectrum disorder using central-moment features from low- and high-order dynamic resting-state functional connectivity networks. Frontiers in Neuroscience, 14, 258.
View at Publisher | View at Google Scholar - Kruschwitz, J. D., List, D., Waller, L., Rubinov, M., & Walter, H. (2015). GraphVar: A user-friendly toolbox for comprehensive graph analyses of functional brain connectivity. Journal of Neuroscience Methods.
View at Publisher | View at Google Scholar - Waller, L., Brovkin, A., Dorfschmidt, L., Bzdok, D., Walter, H., & Kruschwitz, J. (2018). GraphVar 2.0: A user-friendly toolbox for machine learning on functional brain connectivity measures. Journal of Neuroscience Methods.
View at Publisher | View at Google Scholar - Rikandi, E., Mäntylä, T., Lindgren, M., Kieseppä, T., Suvisaari, J., & Raij, T. T. (2022). Functional network connectivity and topology during naturalistic stimulus is altered in first-episode psychosis. Schizophrenia Research, 241, 83-91.
View at Publisher | View at Google Scholar - Dacosta-Aguayo, R., Lamonja-Vicente, N., Chacón et al (2022). Neurocognitive Profile of the Post-COVID Condition in Adults in Catalonia-A Mixed Method Prospective Cohort and Nested Case-Control Study: Study Protocol. Vaccines, 10(6), 849.
View at Publisher | View at Google Scholar - Nestor, L. J., & Ersche, K. D. (2023). Abnormal Brain Networks Related to Drug and Nondrug Reward Anticipation and Outcome Processing in Stimulant Use Disorder: A Functional Connectomics Approach. Biological Psychiatry: Cognitive Neuroscience and Neuroimaging, 8(5), 560-571.
View at Publisher | View at Google Scholar - Zhu, J., Xu, C., Zhang, X. et al (2021). Altered topological properties of brain functional networks in drug- resistant epilepsy patients with vagus nerve stimulators. Seizure, 92, 149–154.
View at Publisher | View at Google Scholar - Weiler, M., Casseb, R. F., de Campos, B. M. et al (2018). Cognitive Reserve Relates to Functional Network Efficiency in Alzheimer's Disease. Frontiers in Aging Neuroscience, 10, 255.
View at Publisher | View at Google Scholar - Walter, M., Alizadeh, S., Jamalabadi, et al (2019). Translational machine learning for psychiatric neuroimaging. Progress in Neuro-Psychopharmacology & Biological Psychiatry, 91, 113-121.
View at Publisher | View at Google Scholar - Yang, T., Ren, J., Zhang et al (2022). Pretreatment topological disruptions of whole-brain networks exist in childhood absence epilepsy: A resting-state EEG-fMRI study. Epilepsy Research, 182, 106909.
View at Publisher | View at Google Scholar - Yan, C. G., Wang, X. D., Zuo, X. N., & Zang, Y. F. (2016). DPABI: Data Processing & Analysis for (Resting-State) Brain Imaging. Neuroinformatics, 14(3), 339-351.
View at Publisher | View at Google Scholar - Chao-Gan, Y. A. N. (2014). DPABI: a toolbox for Data Processing & Analysis for Brain Imaging.
View at Publisher | View at Google Scholar - Friston, K. J. (2003). Statistical Parametric Mapping. In: Kötter, R. (Eds.), Neuroscience Databases. Springer, Boston, MA.
View at Publisher | View at Google Scholar - Penny, W. D., Friston, K. J., Ashburner, J. T., Kiebel, S. J., & Nichols, T. E. (Eds.). (2011). Statistical parametric mapping: the analysis of functional brain images. Elsevier.
View at Publisher | View at Google Scholar - Geerligs, L., Cam-Can, & Henson, R. N. (2016). Functional connectivity and structural covariance between regions of interest can be measured more accurately using multivariate distance correlation. NeuroImage, 135, 16-31.
View at Publisher | View at Google Scholar - Rolls, E. T., Huang, C. C., Lin, C. P., Feng, J., & Joliot, M. (2020). Automated anatomical labelling atlas 3. NeuroImage, 206, 116189.
View at Publisher | View at Google Scholar - Plitt, M., Barnes, K. A., & Martin, A. (2014). Functional connectivity classification of autism identifies highly predictive brain features but falls short of biomarker standards. NeuroImage. Clinical, 7, 359-366.
View at Publisher | View at Google Scholar - Yang, M., Cao, M., Chen, Y., Chen, Y., Fan, G., Li, C., Wang, J., & Liu, T. (2021). Large-Scale Brain Functional Network Integration for Discrimination of Autism Using a 3-D Deep Learning Model. Frontiers in human neuroscience, 15, 687288.
View at Publisher | View at Google Scholar
