

Research Article | DOI: https://doi.org/10.31579/2834-8389/040
An Evaluation of Pharmacological Healing Potentialities Of Phyllanthus Emblica And Terminalia Chebula On Experimental Rat Models*
- Shanjida Islam 1
- Mustafiz Chowdhury 2
- Toki Tazwar Islam 1
- Najibah Nasrin 3
- Rifah Noor Chowdhury 4
- Rafat Tahsin 5*
- Israt Jahan 6
- Jakir Ahmed Chowdhury 3
- Shaila Kabir 1
- Abu Asad Chowdhury 1
- Fahima Aktar 1
- Shah Amran 1
1Molecular Pharmacology and Herbal Drug Research Laboratory, Department of Pharmaceutical Chemistry, Faculty of Pharmacy, University of Dhaka, Dhaka 1000, Bangladesh.
2Department of Pharmacy, University of Chittagong.
3Department of Pharmaceutical Technology, Faculty of Pharmacy, University of Dhaka, Dhaka 1000, Bangladesh.
4Department of Pharmacy, Faculty of Pharmacy, University of Dhaka, Dhaka 1000,
Bangladesh.
5Department of Pharmaceutical Sciences, North South University, Plot # 15, Block # B, Bashundhara R/A, Dhaka 1229, Bangladesh.
6Department of Pharmacy, University of Asia Pacific, Farmgate, Dhaka, Bangladesh.
*Corresponding Author: Rafat Tahsin, Department of Pharmaceutical Sciences, North South University, Plot # 15, Block # B, Bashundhara R/A, Dhaka 1229, Bangladesh.
Citation: Islam S., Chowdhury M, Toki T Islam, Nasrin N., Rifah N Chowdhury, (2025), An evaluation of pharmacological healing potentialities of phyllanthus emblica and terminalia chebula on experimental rat models., International Journal of Clinical Case Reports, 4(1); DOI:10.31579/2834-8389/040
Copyright: © 2025, Rafat Tahsin. This is an open access article distributed under the Creative Commons Attribution License, which permits unrestricted use, distribution, and reproduction in any medium, provided the original work is properly cited.
Received: 02 January 2025 | Accepted: 10 January 2025 | Published: 23 January 2025
Keywords: anti–hyperglycemic; Phyllanthus emblica; Terminalia chebula; anti–hypertensive; antidiabetic
Abstract
Background: Plants are known to contain potent phytochemical compounds that possess valuable pharmacological properties against various ailments. The cost, inadequacy and adverse effects of conventional medications have urged the investigators to look for better, safer, economical and more effective alternatives. The widespread availability of plants and their fewer side effects serve as rational motives for the investigation. Phyllanthus emblica is used widely in traditional medicine to alleviate various moderate to severe diseases and known to possess analgesic, anti-inflammatory, anti–oxidant and hepatoprotective properties while T. chebula possesses anti-diabetic, anti-ulcerant, anti–microbial properties. In this study, we attempted to determine the therapeutic potentialities of dried Phyllanthus emblica and T. chebula fruits through in vivo and in silico approaches.
Methods: Dried fruits of Terminalia chebula and Phyllanthus emblica were collected, washed, dried and ground to coarse powder, 40 gm of methanolic extract was obtained.
Results: The ethanolic extract of Terminalia chebula possesses a promising effect on the animal model as an analgesic, anti–hypertensive and anti–hyperglycemic and cardioprotective as shown through the relevant tests, as significant (p<0.05) or highly significant (p<0.01) activity in a dose– and source–dependent manner. Low dose pretreatment groups were provided with 0.652 g/kg Phyllanthus emblica of body weight while the high dose pretreatment groups received 1.564 g/kg extracts. Low dose pretreatment groups of Terminalia chebula received 0.492 g/kg body weight and high dose pretreatment groups received 1.180 g/kg body weight extracts. Essential parameters such as the heart rate (HR), blood pressure (BP), blood glucose, SGPT, SGOT, creatinine and lipid profiles (TG, TC, HDL, LDL) were carefully evaluated at regular intervals.
Conclusion: The study provides significant evidence that these plants can be considered as potential therapeutic agents. Thorough phytochemical and pharmacological investigation may open up a new horizon and aid in discovering antidiabetic, anti–hypertensive or anti–inflammatory and cardioprotective drugs in the management of a number of disease conditions.
Introduction
Plants have been known by man for their invaluable properties since the dawn of time, and have been employed in a number of ways throughout history. Medicinal plants have a significant role in the healthcare system, particularly in the underdeveloped nations where herbal medicine has been long in practice. These plants contain a variety of chemical compounds having a variety of medicinal benefits. Novel chemical compounds generated from medical plants may have therapeutic utility, according to the experts. As a result, scientists are actively looking for alternative or plant–based herbal medicines to treat a variety of maladies, including pain and inflammation, cancer, diabetic, hypertension and a variety of other disorders. Phyllanthus emblica, a member of the Phyllanthaceae family, known as emblic, emblic myrobalan, myrobalan, Indian gooseberry, Malacca tree or amla, which is derived from the Sanskrit word ‘Amlaki’. The species is endemic to India, although it may also be found in tropical and subtropical areas such as Pakistan, Uzbekistan, Sri Lanka, Southeast Asia, China, and Malaysia [1]. The presence of alkaloids, oil, fat, glycerides, carbohydrates, phenolics, tannins, lignin, saponins, flavonoids, and terpenoids was discovered in the leaves and fruit of P. emblica after a qualitative screening of phytochemical components [2]. Phyllanthus emblica is abundant in nutrients and might be a good source of vitamin C, amino acids and minerals including phenolic compounds such as tannins, phyllembelic acid, phyllembelin, rutin, curcum-inoids, andemblicol [3]. This plant possesses anticancer, anti–inflammatory, anti–diabetic, cardio protective, hepatoprotective, anti–oxidant, anti–microbial, antipyretic, analgesic, anti–diarrheal, antidysentric, hypolipidemic, nephroprotective, immunostimulant, gastroprotective effects etc [4–5]. Terminalia chebula is a species of Terminalia that belongs to the Combretaceae family and is sometimes known as black – or chebulic myrobalan. It is indigenous to South Asia, stretching from India and Nepal east to southwest China (Yunnan) and south to Sri Lanka, Malaysia, and Vietnam. T. chebula has a tannin content of 32%. T. chebula is a pyrogallol (hydrolysable) species with 14 hydrolysable tannin components including (gallic acid, chebulic acid, punicalagin, chebulanin, corilagin, neochebulinic, ellagic acid, chebulegic acid, chebulinic acid, 1,2,3,4,6–penta–O galloyl–ß–D–glucose, 1,6–di–O–g alloy–D–glucose, casuarinin, 3,4,6–tri–O–galloyl–D–glucose and terchebulin) [6]. It also contains simple phenolic acid derivatives like gallic acid, digallic acid, ellagic acid, ethyl gallate, methyl gallate and flavonoid compounds like rutin, quercetin, luteolin [7]. It has antibacterial activity [8], anti–carcinogenic effects [9], anti–diabetic effect [10] anti-ulcer activity [11], anti–Inflammatory, anti–lipid peroxidative, antioxidant and membrane stabilizing activities [12]. The goal of our present research is to look at the antihypertensive and cardioprotective benefits of T. chebula and P. emblica in a dosage and source dependent way, as well as the relative side effects and liver safety profile study. In the year 2000, the number of adult patients with hypertension was predicted to reach 972 million [13]. During the last few decades, antihypertensive medicines have been the basis of cardiovascular therapy. They are useful for lowering blood pressure (BP), preventing organ damage, overt cardiovascular disease and decreasing mortality. Many drugs like calcium channel blocker, vasodilators, diuretics, Angiotensin–II receptor antagonists, ACE inhibitor, adrenergic receptor antagonists are used as antihypertensive agents [14]. The common side effects of these agents are the sick sinus syndrome which is a kind of heart failure caused by systolic dysfunction, beta–blockers may exacerbate glucose intolerance while masking the symptoms of hypoglycemia, hyponatremia, hypokalemia, metabolic alkalosis, hypovolemia, hypotension, and to a lesser extent, hyponatremia, hypokalemia, metabolic alkalosis, hypovolemia, hypotension, urgent urination, angioneurotic edema which is a potentially fatal adverse effect of the drug, edema in the ankles or feet etc [15]. Another study found that using anti–hypertensive agent causes cancer [16]. Furthermore, these medications are quite expensive imposing a financial burden on the mass people, creating a risk to the completion of the treatment cycle. Medicinal herbs have been regularly used for a long time to prevent these negative effects. Scientists are collaborating to identify plant–based chemical ingredients that might be used as antihypertensive and cardioprotective medicines. These plant–based medicines have fewer negative effects than the synthetic pharmaceuticals and may be provided at a cheaper cost. Again, the concentration of the plant's chemical components, whether rising or falling, may activate the desired therapeutic effect, which may be achieved by plant genetic manipulation. By doing so, we can reduce the concentration of plant metabolites that have negative effects on the human body. For example, a reverse genetics approach, can boost the biosynthesis of secondary metabolites like alkaloid [17]. The functional examination of a gene in reverse genetics begins with the gene sequence rather than a mutant phenotype [18]. Further studies may aid in the separation and purification of the active component from this plant with anti–hypertensive and cardioprotective characteristics, perhaps leading to the discovery of novel drugs.
Method And Materials
Collection of Plant material
Dried fruits of Phyllanthus emblica and Terminalia chebula were bought from Taqwa Baniari Shop, Dhaka, Bangladesh. 1 kg of each fruits was collected and then washed with purified water. After proper washing, fruits were sun dried for several days. The dried fruits were then ground to coarse powder using high–capacity grinding machine.
Extraction of Plant Material
700 gm of Phyllanthus emblica powdered material and 700 mg of Termialia chebula powdered materials were taken in a clean round bottle flask (5 litter) individually and both the powders were soaked in 2 liters of methanol. The container with its content was kept for a period of 14 days accompanying occasional stirring and shaking. The whole of the mixture was then filtered through fresh cotton plug and finally with Whatman No.1 filter paper individually. The volume of filtrate was then reduced using a Buchii Rotavapor at low temperature and pressure. The weight of crude extract was 40 gm for Phyllanthus emblica and 42 gm for Terminalia chebula.
Botanical authentication:
The fruits of Phyllanthus emblica and Terminalia chebula were collected from Taqawa Baniari shop, Dhaka, Bangladesh. Voucher specimens are (DACB no. 43440) and (DACB no. 43438) respectively for these plants have been maintained in Bangladesh National Herbarium, Dhaka, Bangladesh for future reference.
Drugs and Chemicals
Among the drugs used in this study, ketamine hydrochloride (brand name: Ketalar; manufacturer: Popular Pharmaceuticals Ltd, Bangladesh) was purchased from local retail pharmacy; digoxin (brand name: Dixin) was imported from Samarth Life Science Private Ltd, India). HPLC grade methanol (99.9%) as well as biotech grade ethanol (99%) was sourced from Merck, Germany.
Experimental Animal Procurement, Nursing and Grouping
Twenty healthy Sprague-Dawley albino rats (90–140 gm) were obtained from the Animal Unit, Department of Pharmacy, Jahangirnagar University, Dhaka. The rats were individually held in stainless steel cages at room temperature and with sufficient ventilation in Animal house, Institute of Nutrition and Food Science, University of Dhaka. The rats were randomly divided into five groups (n=4 rats/group). Distilled water was the only source of fluid along with liquid drug twice a day in pretreatment groups for 21 days. Standard fluid and feeds were provided 3 times a day during of study (21 days). At the end of study, each rat was re–weighted before being anesthetized with Ketamine Hydrochloride, intra–peritoneal (IP) injection.
Drug Dose Determination
Low dose pretreatment groups received 100 mg of Phyllanthus emblica which is calculated for 1 kg adult and re–estimated for rats to 0.652 g/kg body weight and high dose pretreatment groups received 400 mg of Phyllanthus emblica which is calculated for 1 kg adult and re–estimated for rats to 1.564 g/kg body weight. Low dose pretreatment groups received 100 mg of Terminalia chebula which is calculated for 1 kg adult and re–estimated for rats to 0.492 g/kg body weight and high dose pretreatment groups received 400 mg of Terminalia chebula which is calculated for 1 kg adult and re–estimated for rats to 1.180 g/kg body weight.
Induction of Arrhythmia
Digoxin has been chosen to induce arrhythmia for this study. Digoxin arrhythmogenic dose (AD50) in adult rats 13.0±1.0 mg/kg [19], was taken as reference point to start screening for arrhythmogenic dose of digoxin for current study. Each ml of Digoxin injection (Dixin) contains Digoxin IP 0.25 mg/water for injection IP used as doses of 8.0 mg/kg, 10.0 mg/kg, 15.0 mg/kg, 20.0 mg/kg. These were administered intraperitoneally in ketamine hydrochloride anaesthetized rats and the electrocardiogram was monitored continuously for 60 minutes auto (all leads) and rhythm (lead II) was recorded to observe any characteristic changes in heart beats. A concentration of 20 mh/kg was chosen which induced arrhythmia without causing rat death for 60 minutes.
ECG measurement
ECG’s recording were performed after a 20 min intraperitoneal injection of (50mg/kg, body weight) ketamine hydrochloride and for a period of 30 min before and 60 min after intraperitoneal injection of digoxin (20mg/kg body weight). Arrhythmia were assessed by identifying and quantifying the different arrhythmias and changes in heart rate during the 60 min recording period.
The electrocardiogram was recorded as lead I, II, III, aVR, aVL, aVF and V (chest lead). The recording apparatus was EDAN VET–300. For this study only lead II was discussed. This procedure was repeated for every rat [20].
Blood pressure measurement
To train and improve animal acclimation, by placing the animal in the holder for 15 minutes for 3 consecutive days prior to the actual study. Place each animal in a holder by picking up the animal by the tail and gently placing the animal into the rear of the holder which faces the open end of the nose cone. The rat was taken from the animal house and brought in laboratory. After providing the rat an hour to acclimatize, thread the tail through the cuff as close to the base of the tail as much as possible without force. Heart rate, systolic blood pressure, mean blood pressure, diastolic blood pressure displayed on LCD and data should be recorded. After finishing the experiment remove the animal from the cuffs and holder [21]. The experimental rats were segmented into five groups; group-1 was used as control groups and the rest of the groups (group-2 to group-5) were utilized as test groups for the study. The rats in the control group did not receive any plant extract. However, among the test groups, group-2 and group-4 rats were fed with Phylanthus emblica extract at a rate of 0.652g/kg body weight (low dose, pretreated) and 1.564g/kg body weight (high dose) respectively. On the other hand, group-3 and group-5 rats received Terminalia chebula extract at a rate of 0.492g/kg body weight and 1.180g/kg body weight (high dose), respectively.
Results:
Phyllanthus emblica (Amalaki)
Measurement of blood pressure
Table 1: BP & HR for Control group.
Measurement of Blood Pressure of Control | |||
Rat no | Heart Rate | Systolic | Diastolic |
1 | 407 | 110 | 65 |
2 | 390 | 109 | 74 |
3 | 419 | 115 | 70 |
4 | 400 | 105 | 73 |
Mean | 404 | 109.75 | 70.5 |
SD | 12.1929 | 4.11299 | 4.04145 |
Table 1: Table 1 shows the heart rate, systolic and diastolic blood pressure of control groups.
Table 2: BP & HR for low–dose group:
Measurement of Blood pressure of low dose | |||
Rat no | Heart Rate | Systolic | Diastolic |
1 | 403 | 105 | 60 |
2 | 395 | 115 | 70 |
3 | 380 | 95 | 65 |
4 | 410 | 110 | 74 |
Mean | 397 | 106.25 | 67.25 |
SD | 12.8841 | 8.53913 | 6.07591 |
Table 2: Table 2 shows the heart rate, systolic and diastolic blood pressure of low dose groups.
Table 3: BP & HR for high–dose group:
Measurement of Blood Pressure of High dose | |||
Rat no | Heart Rate | Systolic | Diastolic |
1 | 356 | 105 | 64 |
2 | 380 | 101 | 65 |
3 | 366 | 103 | 68 |
4 | 374 | 110 | 70 |
Mean | 369 | 104.75 | 66.75 |
SD | 10.3923 | 3.86221 | 2.75379 |
Table 3: Table 3 shows the heart rate, systolic and diastolic blood pressure of high dose groups.
Table 4: Comparison of control, low dose and high dose.
Comparison of result of HR and BP of Amalaki | |||
Parameter | HR | SBP | DBP |
Control | 404 | 109 | 70 |
Low dose | 397 | 106 | 67 |
High dose | 369 | 104 | 66 |
Table 4: Table–4 shows the comparison of control, low dose and high dose.
Figure 1: Measurement of Heart rate and Blood pressure after administration of Extract of Amalaki in rats
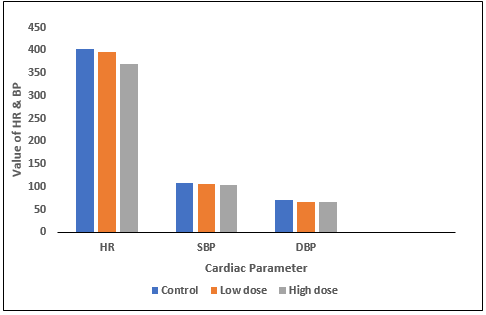
Figure 1: BP and HR of rats from 5 groups. The data were expressed as mean±standard deviation (Does not indicates statistically significant change in blood pressure.)
Hematological Test for Serum Lipid Profile of Amalaki extraction
Serum total cholesterol, triglyceride, high density lipoprotein-cholesterol and low–density protein-cholesterol were analyzed by using spectrometric assay.
Table 5: Serum Lipid profile of control rats.
Specimen | Total cholesterol | Triglyceride | HDL | LDL |
Rat 1 | 83 | 52.8 | 40.2 | 32.24 |
Rat 2 | 78.9 | 26.9 | 29.7 | 43.82 |
Rat 3 | 153.4 | 76.3 | 90.6 | 47.54 |
Rat 4 | 73.4 | 65.5 | 32.1 | 28.2 |
Mean | 97.175 | 55.375 | 48.15 | 37.95 |
SEM | 16.31986 | 9.212178 | 12.40768 | 3.985063 |
Table 5: Table 5 depicts Serum Lipid profile of control rats.
Amalaki Pretreated Groups
Table 6: Serum Lipid profile of Amalaki pretreated rats
Title | Total cholesterol | Triglyceride | HDL | LDL | ||||
dose | low | high | low | high | low | high | low | high |
Rat 1 | 63.4 | 71.05 | 86 | 80.1 | 29.1 | 47 | 17.1 | 8.48 |
Rat 2 | 59.2 | 78.9 | 53.7 | 58.1 | 19.8 | 39.2 | 28.66 | 28.08 |
Rat 3 | 55.5 | 65.8 | 79.3 | 43 | 16.6 | 26.1 | 23.04 | 31.1 |
Rat 4 | 62.9 | 68.2 | 55.9 | 51.4 | 22.2 | 31.1 | 29.52 | 26.82 |
Mean | 60.25* | 70.987* | 68.725 | 58.15 | 21.925 | 35.85 | 24.58* | 23.62* |
SEM | 1.59 | 2.4656 | 7.073 | 6.877 | 2.2971 | 3.977 | 2.492 | 4.439 |
Table 6: Table 6 depicts serum Lipid profile of Amalaki pretreated rats.
Concentration values are expressed in me/d1 and presented as mean±SRM ns = not significant, *p<0.05, when compared to control group.
Table 7: Serum Lipid Parameters of Amalaki
Parameter | Control | Amalaki | |
Low dose pretreatment | High dose pretreatment | ||
| Ratio; LDL–C: HDL–C | 0.79 | 1.121 | 0.66 |
| Ratio; TC: HDL–C | 2.018 | 2.75 | 1.6806 |
Table 7: Table 7 depict serum Lipid Parameters of Amalaki.
Measurement of Serum Lipid Profile after admiration of Extract of Amalaki in rats
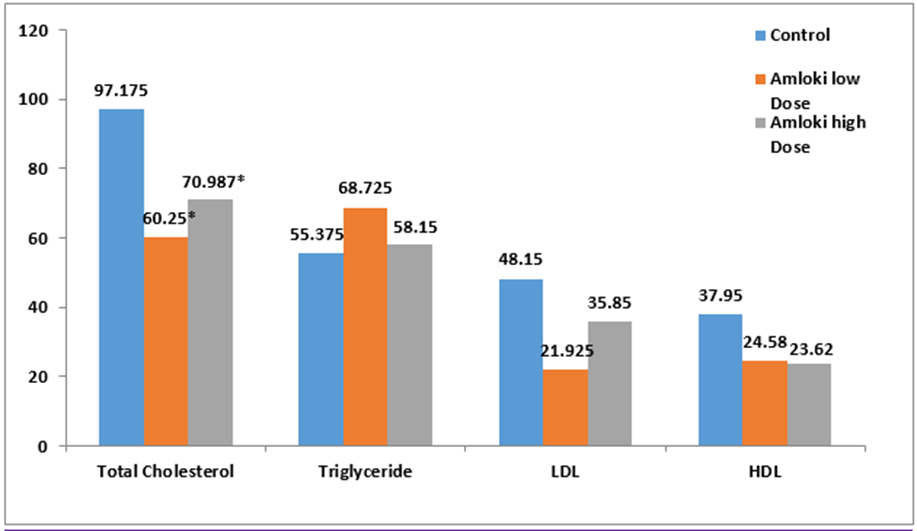
Figure 2: Measurement of Serum Lipid Profile after admiration of Extract of Amalaki in rats.
Response of different groups
Figure 2: Serum Lipid Profile of rats from 5 groups. The data were expressed as mean±standard deviation.
For our results, we can infer that amlaki can successfully reduce total cholesterol level along with LDL levels in rats after chronic ingestion. However, it does not have any notable effects on HDL and triglyceride level.
ECG Results of Amalaki pretreated rats before digoxin
Our results indicate that no significant (P>0.05) change was obtained in heart rate after chronic pretreatment with Amalaki (Table). In addition, there were also no significant changes in heart rate in the RR interval (Table)
Table 8: Mean heart rate of Amalaki pretreated rats
Time | Control | Amalaki low dose | Amalaki High dose | ||||||
Mean | SEM | N | 350.00 | 5.2333 | N | 330.00 | .7071 | N | |
0 | 350.25 | 10.80581 | 4 | 348.55 | 6.8887 | 4 | 436.00 | 3.0625 | 4 |
5 | 401.12 | 8.879161 | 4 | 355.36 | 2.211 | 4 | 298.00 | .8898 | 4 |
10 | 356.66 | 0.955814 | 4 | 345.59 | 3.566 | 4 | 398.56 | 2.2321 | 4 |
15 | 389.16 | 4.637475 | 4 | 347.66 | .50000 | 4 | 402.33 | 1.119 | 4 |
20 | 349.75 | 7.104163 | 4 | 351.11 | 1.978 | 4 | 346.00 | 3.3131 | 4 |
25 | 361.56 | 5.108695 | 4 | 361.33 | 4.2121 | 4 | 357.77 | 2.5656 | 4 |
Table 8: Table 8 shows mean heart rate of Amalaki pretreated rats.
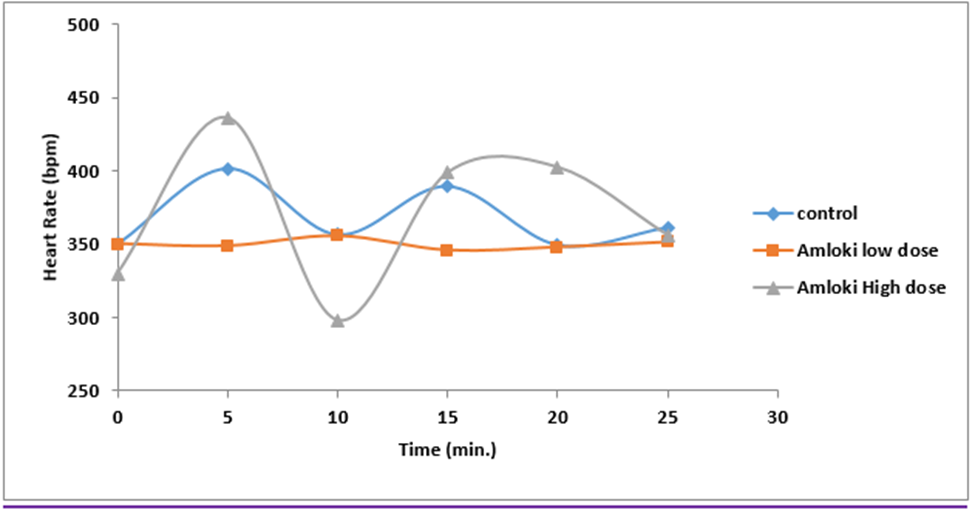
Figure 3: Figure and table shows effect on heart rate of rodents pretreated with Amalaki (low dose=0.652g/kg, High dose=10564g/kg) before Digoxin injection (20mg/kg, IP) N=4. No significant (P>0.05) change was observed in heart rate after chronic pretreatment with Amalaki.
Time(min) | Control | Amalaki low dose | Amalaki high dose | |||
Mean | N | Mean | N | Mean | N | |
0 | 173.567 | 4 | 173.123 | 4 | 175.231 | 4 |
5 | 179.254 | 4 | 172.564 | 4 | 174.563 | 4 |
10 | 171.551 | 4 | 171.991 | 4 | 170.058 | 4 |
15 | 171.796 | 4 | 169.874 | 4 | 171.121 | 4 |
20 | 162.897 | 4 | 171.231 | 4 | 172.025 | 4 |
25 | 169.231 | 4 | 174.069 | 4 | 174.500 | 4 |
Table 9: Mean RR interval of Amalaki pretreated rats.
Table 9: shows effect on RR interval of rodents pretreated with Amalaki (low dose=0.652g/kg, High dose=1.564g/kg) before Digoxin injection (20mg/kg, IP) N=4. No significant (P>0.05) change was observed in heart rate after chronic pretreatment with Amalaki.
ECG Results of Amalaki pretreated rats after digoxin
After treatment with digoxin, amlaki treated rats did not show any significant changes in heart rate (Table). Similarly, heart rate of rats after digoxin treatment RR interval does not give any significant result for either of the amlaki doses.
Table 10: Mean heart rate of Amalaki pretreated rats after digoxin
Time | Digoxin control | Amalaki low dose | Amalaki High dose | ||||||
Mean | SEM | N | Mean | SEM | N | Mean | SEM | N | |
0 | 340.2500 | 17.2323 | 4 | 330.0000 | 10.5859 | 4 | 217.5000 | 8.4798 | 4 |
5 | 246.5000 | 5.55555 | 4 | 238.5111 | 17.1773 | 4 | 205.7500 | 16.4589 | 4 |
15 | 234.2500 | 23.2785 | 4 | 256.2222 | 3.75277 | 4 | 256.2500 | 12.5707 | 4 |
25 | 249.0000 | 12.8975 | 4 | 257.3131 | 24.7772 | 4 | 354.5000 | 23.7394 | 4 |
35 | 277.7500 | 9.80646 | 4 | 256.9856 | 6.32941 | 4 | 298.9875 | 44.8265 | 4 |
45 | 241.3333 | 10.2428 | 4 | 232.6989 | 21.9141 | 4 | 240.3232 | 30.0288 | 4 |
60 | 269.3000 | 15.9141 | 4 | 269.7979 | 14.5859 | 4 | 274.1111 | 10.2428 | 4 |
Table 10: Table 10 shows mean heart rate of Amalaki pretreated rats after digoxin.
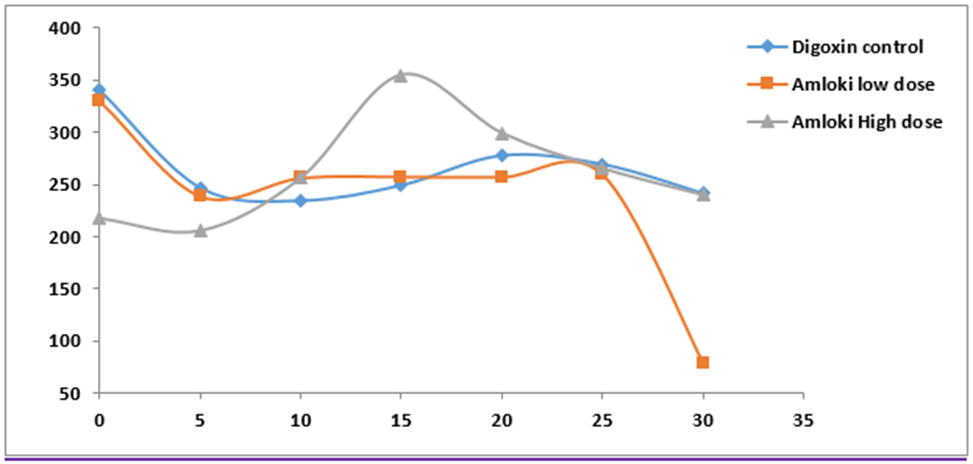
Figure 4: Figure. and table shows no significant (p>0.05) change in heart rate after chronic pretreatment with Amalaki on digoxin induce Arrhythmia. N=4
Table 11: Mean RR interval of Amalaki pretreated rats after digoxin administration.
Time(min.) | Control | Amalaki low dose | Amalaki high dose | |||
Mean | N | Mean | N | Mean | N | |
0 | 229.007 | 4 | 356.00 | 4 | 204.5000 | 4 |
5 | 298.025 | 4 | 259.012 | 4 | 211.6000 | 4 |
15 | 247.264 | 4 | 415.231 | 4 | 318.7500 | 4 |
25 | 255.292 | 4 | 261.569 | 4 | 236.0000 | 4 |
35 | 235.887 | 4 | 242.166 | 4 | 224.2555 | 4 |
45 | 278.001 | 4 | 220.500 | 4 | 174.2500 | 4 |
60 | 342.213 | 4 | 228.222 | 4 | 221.5000 | 4 |
Table 11: shows effect on RR interval of rodents pretreated with Amalaki (low dose=0.652g/kg, High dose=1.564g/kg) after Digoxin injection (20mg/kg, IP) N=4.
Measurement of Blood Glucose level in normal rat by Amalaki
Table 12: Comparison of control group, low-dose group and high-dose group
Comparison of Glucose lowering activity of glucose of Amalaki | ||||||||
Parameter | Day1 | Day3 | Day6 | Day9 | Day12 | Day15 | Day18 | Day21 |
Control | 6 | 6 | 6 | 6 | 6 | 6 | 6 | 6 |
Low dose | 6 | 6 | 6 | 6 | 6 | 6 | 5 | 5 |
High dose | 6 | 6 | 5 | 5 | 5 | 5 | 5 | 5 |
Table 12: Table 12 shows the comparison of control group, low-dose group and high-dose group.
Figure 5: Blood Glucose level of control, low and high dose group
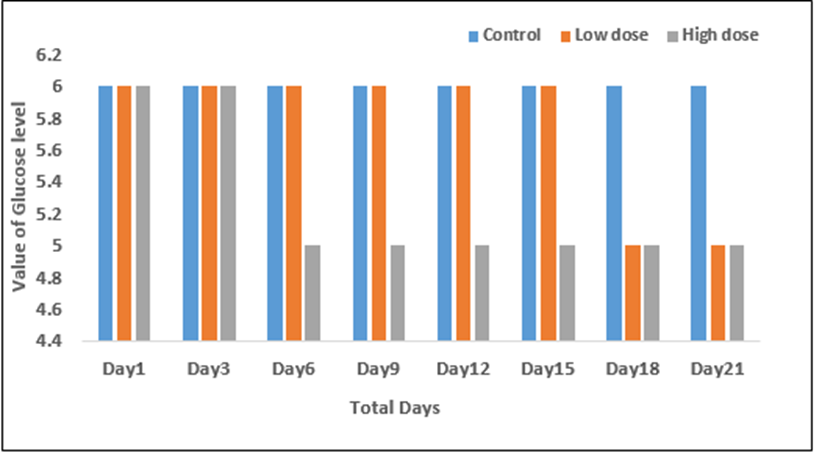
Figure 5: Doesn’t have significant antidiabetic activity.
Terminalia chebula (Haritaki)
Measurement of Blood Pressure
Table 13: BP & HR of Control group
Measurement of Blood Pressure of Control | |||
Rat no | Heart Rate | Systolic | Diastolic |
1 | 407 | 110 | 65 |
2 | 390 | 109 | 74 |
3 | 419 | 115 | 70 |
4 | 400 | 105 | 73 |
Mean | 404 | 109.75 | 70.5 |
SD | 12.1929 | 4.11299 | 4.04145 |
Table 13: Table 13 showing the BP & HR of Control group.
Table 14: BP & HR of Low-dose group
Measurement of Blood Pressure of low dose | |||
Rat | Heart Rate | Systolic | Diastolic |
R1 | 375 | 109 | 68 |
R2 | 381 | 115 | 71 |
R3 | 401 | 99 | 75 |
R4 | 392 | 101 | 65 |
Mean | 387.25 | 106 | 69.75 |
SD | 11.5578 | 7.39369 | 4.272 |
Table 14: Table 14 shows BP & HR of Low-dose group.
Table 15: BP & HR of High–dose group
Measurement of Blood Pressure of High dose | |||
Rat no | Heart Rate | Systolic | Diastolic |
1 | 382 | 104 | 68 |
2 | 377 | 110 | 72 |
3 | 394 | 102 | 70 |
4 | 388 | 106 | 65 |
Mean | 385.25 | 105.5 | 68.75 |
SD | 7.36546 | 3.41565 | 2.98608 |
Table 15: Table 15 shows BP & HR of Low-dose group.
Table 16: Comparison of Result of HR, SBP and DBP
Comparison of result of HR and BP of Haritaki | |||
Parameter | HR | SBP | DBP |
Control | 404 | 109 | 70 |
Low dose | 387 | 106 | 69 |
High dose | 385 | 105 | 68 |
Table 16: Table 16 shows comparison of Result of HR, SBP and DBP.
Figure 6: Measurement of Heart rate and Blood pressure after admiration of Extract of Haritaki in rats
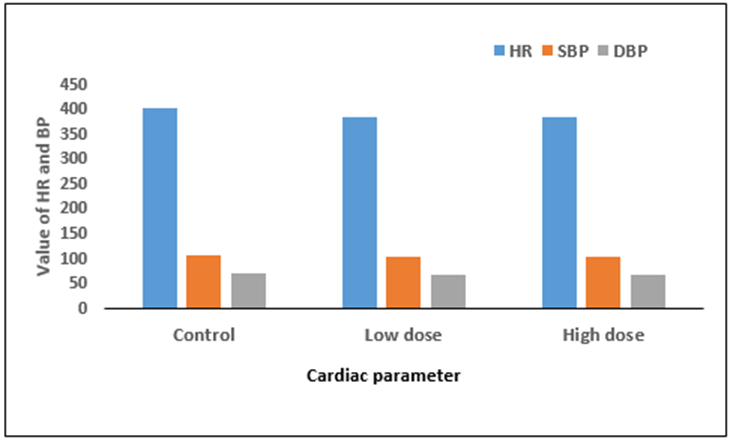
Figure 6: BP and HR of rats from 5 groups. The data were expressed as mean±standard deviation. (Does not indicates statistically significant change in blood pressure.
Response of the different groups
Hematological Test for Serum Lipid Profile for Haritaki extract
Serum total cholesterol, triglyceride, high density lipoprotein–cholesterol and low density, protein-cholesterol were analyzed by using spectrometric assay.
Table 17: Serum Lipid profile of control Rats
Specimen | Total cholesterol | Triglyceride | HDL | LDL |
Rat 1 | 83 | 52.8 | 40.2 | 32.24 |
Rat 2 | 78.9 | 26.9 | 29.7 | 43.82 |
Rat 3 | 153.4 | 76.3 | 90.6 | 47.54 |
Rat 4 | 73.4 | 65.5 | 32.1 | 28.2 |
Mean | 97.175 | 55.375 | 48.15 | 37.95 |
SEM | 16.31986 | 9.212178 | 12.40768 | 3.985063 |
Table 17: Table 17 shows serum Lipid profile of control Rats.
Haritaki Pretreated Groups
Table 18: Serum Lipid profile of Haritaki pretreated Rats
Sample | Total cholesterol | Triglyceride | HDL | LDL | ||||
Dose | low | high | low | high | low | high | low | high |
Rat 1 | 86 | 52.3 | 45.8 | 40.9 | 48.7 | 17.9 | 28.14 | 26.22 |
Rat 2 | 53.7 | 61.1 | 27.7 | 68.7 | 38.6 | 18.9 | 9.56 | 28.46 |
Rat 3 | 79.3 | 72.5 | 22.7 | 56.3 | 29.8 | 26.8 | 25.76 | 34.44 |
Rat 4 | 55.9 | 54.4 | 47.3 | 71.5 | 36 | 24.7 | 10.44 | 15.4 |
Mean | 68.725* | 60.07* | 35.875 | 59.35 | 38.275 | 22.075 | 18.475* | 26.13 |
SEM | 7.07322 | 3.937698 | 5.416684 | 6.045401 | 3.407597 | 1.882942 | 4.261176 | 3.442619 |
Table 18: Table 18 shows Serum Lipid profile of Haritaki pretreated Rats.
Concentration values are expressed in me/d1 and presented as mean±SRM ns = not significant, *p<0.05, when compared to control group.
Table 19: Serum Lipid Parameters of Haritaki
Parameter | Control | Haritaki | |
Low dose pretreatment | High dose pretreatment | ||
Ratio; LDL-C: HDL-C | 0.79 | 0.483 | 1.184 |
Ratio; TC: HDL-C | 2.018 | 1.796 | 1.796 |
Table 19: Table 19 shows serum Lipid Parameters of Haritaki.
Figure 7: Measurement of Serum Lipid Profile after admiration of Extract of Haritaki in rats
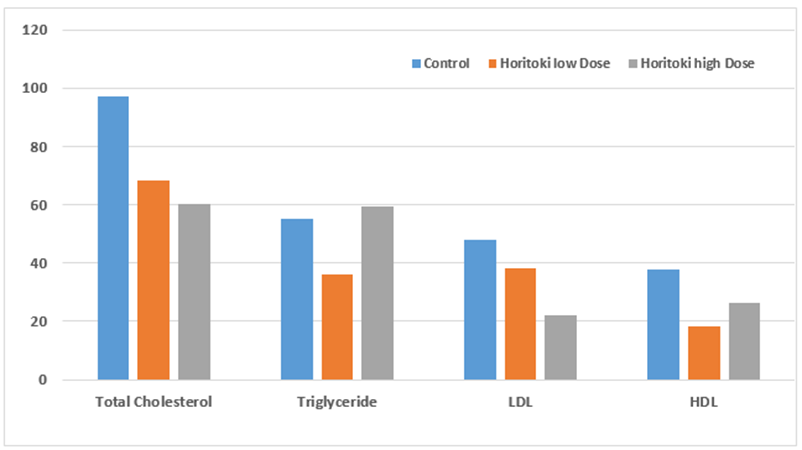
Figure 7: For our results, we can infer that Haritaki can successfully reduce total cholesterol level along with LDL levels in rats after chronic ingestion. However, it does not have any notable effects on HDL and triglyceride level.
*P<0.05; #P<0.05 when compared to low dose TC = Total Cholesterol, TG= Triglyceride.
Induction of Arrhythmia: ECG Results of Haritaki
ECG Results of Haritaki pretreated rats before digoxin
Our results indicate that no significant (P>0.05) change was obtained in heart rate after chronic pretreatment with Haritaki (Table). In addition, there were also no significant changes in heart rate in the RR interval (Table).
Table 20: Mean heart rate of Haritaki pretreated rats
Time (min) | Control | Haritaki low dose | Haritaki High dose | ||||||
Mean | SEM | N | Mean | SEM | N | Mean | SEM | N | |
0 | 350.25 | 10.80581 | 4 | 378.55 | 2.8887 | 4 | 336.00 | 5.310 | 4 |
5 | 401.12 | 8.879161 | 4 | 365.36 | 1.211 | 4 | 350.00 | 2.240 | 4 |
10 | 356.66 | 0.955814 | 4 | 445.59 | .5660 | 4 | 348.56 | 0.536 | 4 |
15 | 389.16 | 4.637475 | 4 | 347.66 | .70000 | 4 | 342.33 | 4.233 | 4 |
20 | 349.75 | 7.104163 | 4 | 351.11 | 3.1313 | 4 | 336.00 | 0.897 | 4 |
25 | 361.56 | 5.108695 | 4 | 381.33 | 1.2121 | 4 | 357.77 | 2.6567 | 4 |
Table 20: Table 20 shows mean heart rate of Haritaki pretreated rats.
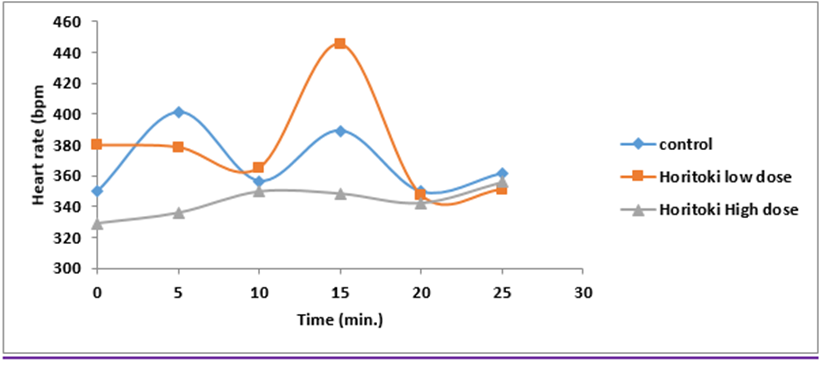
Figure 4.8: figure and table show effect on heart rate of rodents pretreated with Haritaki (low dose=0.492g/kg, High dose=1.180g/kg) before Digoxin injection (20mg/kg, IP) N=4.
No significant (P>0.05) change was observed in heart rate after chronic pretreatment with Haritaki.
Table 21: Mean RR interval of Haritaki pretreated rats
Time(min.) | Control | Haritaki low dose | Haritaki high dose | |||
Mean | N | Mean | N | Mean | N | |
0 | 173.567 | 4 | 180.222 | 4 | 175.666 | 4 |
5 | 179.254 | 4 | 179.779 | 4 | 180.911 | 4 |
10 | 171.551 | 4 | 181.225 | 4 | 180.001 | 4 |
15 | 171.796 | 4 | 177.777 | 4 | 175.005 | 4 |
20 | 162.897 | 4 | 178.002 | 4 | 169.225 | 4 |
25 | 169.231 | 4 | 179.005 | 4 | 172.112 | 4 |
Table 21: shows effect on RR interval of rodents pretreated with Haritaki (low dose = 0.492g/kg, High dose = 1.180g/kg) before Digoxin injection (20mg/kg, IP) N=4.
No significant (P>0.05) change was observed in heart rate after chronic pretreatment with Haritaki.
ECG Results of Haritaki pretreated rats after digoxin
After treatment with digoxin, haritaki treated rats did not show any significant changes in heart rate (Table). Similarly, heart rate of rats after digoxin treatment RR interval does not give any significant result for either of the haritaki doses. So it can be concluded that haritaki does not have any notable effects on arrhythmic heart rate induced by digoxin.
Table 22: Mean heart rate of Haritaki pretreated rats after digoxin
Time (min) | Digoxin control | Haritaki low dose | Haritaki High dose | ||||||
Mean | SEM | N | Mean | SEM | N | Mean | SEM | N | |
0 | 340.2500 | 17.2323 | 4 | 230.0000 | 10.5000 | 4 | 223.5000 | 5.03333 | 4 |
5 | 246.5000 | 5.55555 | 4 | 288.5111 | 18.1555 | 4 | 205.7500 | 15.6665 | 4 |
10 | 234.2500 | 23.2785 | 4 | 286.2222 | 5.23210 | 4 | 269.2500 | 18.5550 | 4 |
15 | 249.0000 | 12.8975 | 4 | 257.3131 | 32.5690 | 4 | 330.5000 | 25.4122 | 4 |
20 | 277.7500 | 9.80646 | 4 | 206.9856 | 9.58000 | 4 | 225.5675 | 36.0005 | 4 |
25 | 241.3333 | 10.2428 | 4 | 189.6989 | 12.0050 | 4 | 265.3232 | 28.0288 | 4 |
30 | 269.3000 | 15.9141 | 4 | 239.7979 | 15.5809 | 4 | 240.2222 | 12.2428 | 4 |
Table 22: Table 22 shows mean heart rate of Haritaki pretreated rats after digoxin.
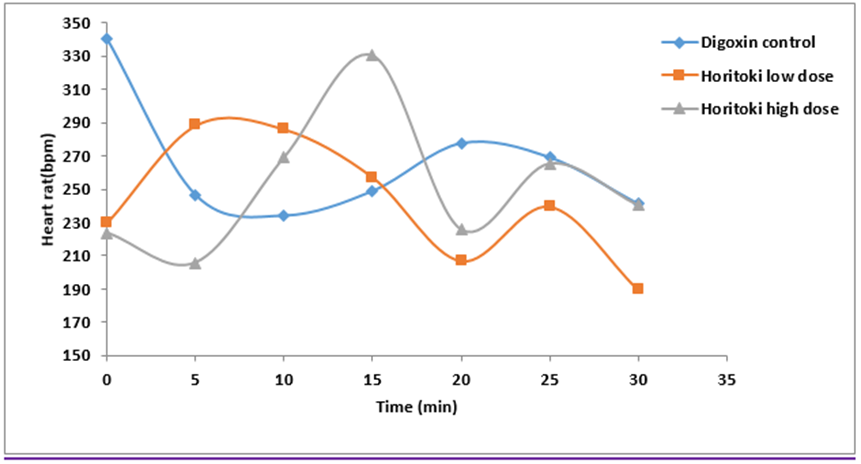
Figure 9: Figure. and table shows no significant (p>0.05) change in heart rate after chronic pretreatment with Haritaki on digoxin induce Arrhythmia. N=4.
Table 23: Mean RR interval of Haritaki pretreated rats after digoxin administration.
Time(min.) | Digoxin Control | Haritaki low dose | Haritaki high dose | |||
Mean | N | Mean | N | Mean | N | |
0 | 229.007 | 4 | 208.000 | 4 | 351.222 | 4 |
5 | 298.025 | 4 | 284.750 | 4 | 289.300 | 4 |
15 | 247.264 | 4 | 238.500 | 4 | 256.250 | 4 |
25 | 255.292 | 4 | 218.250 | 4 | 287.213 | 4 |
30 | 235.887 | 4 | 190.600 | 4 | 225.666 | 4 |
45 | 278.001 | 4 | 231.250 | 4 | 241.500 | 4 |
60 | 342.213 | 4 | 310.000 | 4 | 256.555 | 4 |
Table 23: Table 23 shows mean RR interval of Haritaki pretreated rats after digoxin administration.
Measurement of Blood Glucose level in normal rat by Haritaki
Table 24: Glucose level of Control Group
Measurement of Glucose lowering activity of Control | ||||||||
Control rat | Day 1 | Day 3 | Day 6 | Day 9 | Day 12 | Day 15 | Day 18 | Day 21 |
1 | 5.9 | 5.9 | 5.8 | 5.9 | 5.6 | 5.8 | 5.9 | 5.7 |
2 | 6 | 6 | 5.9 | 6 | 5.8 | 6.1 | 6 | 6 |
3 | 6.3 | 6.3 | 6.2 | 6.1 | 6 | 6.2 | 6.1 | 6.1 |
4 | 6.9 | 6.9 | 6.7 | 6.8 | 6.6 | 6.8 | 6.5 | 6.7 |
Mean | 6.275 | 6.275 | 6.15 | 6.2 | 6 | 6.225 | 6.125 | 6.125 |
SD | 0.45 | 0.45 | 0.404145 | 0.408248 | 0.432049 | 0.419325 | 0.262996 | 0.419325 |
Table 24: Table 24 shows glucose level of Control Group.
Table 25: Glucose level of Low-dose Group
Measurement of Glucose lowering activity of low dose | ||||||||
Low dose | Day 1 | Day 3 | Day 6 | Day 9 | Day 12 | Day 15 | Day 18 | Day 21 |
1 | 7.1 | 7.1 | 7 | 7 | 6.9 | 6.7 | 6.7 | 6.5 |
2 | 7.2 | 7.2 | 7.1 | 7 | 6.8 | 6.8 | 6.6 | 6.5 |
3 | 7 | 7 | 6.8 | 6.8 | 6.6 | 6.5 | 6.4 | 6.4 |
4 | 6.8 | 6.8 | 6.7 | 6.6 | 6.6 | 6.4 | 6.2 | 6.1 |
Mean | 7.025 | 7.025 | 6.9 | 6.85 | 6.725 | 6.6 | 6.475 | 6.375 |
SD | 0.170783 | 0.170783 | 0.182574 | 0.191485 | 0.15 | 0.182574 | 0.221736 | 0.189297 |
Table 25: Table 25 shows glucose level of Low-dose Group.
Table 26: Glucose level of High-dose Group
Measurement of Glucose lowering activity high dose | ||||||||
High Dose | Day 1 | Day 3 | Day 6 | Day 9 | Day 12 | Day 15 | Day 18 | Day 21 |
1 | 6.7 | 6.7 | 6.4 | 6.2 | 6.1 | 5.9 | 5.7 | 5.5 |
2 | 7.2 | 7.2 | 7.1 | 7 | 7 | 6.7 | 6.4 | 5.9 |
3 | 7.6 | 7.6 | 7.4 | 7.3 | 7.1 | 6.9 | 6.6 | 6.3 |
4 | 6.4 | 6.4 | 6.3 | 6.1 | 6 | 5.8 | 5.8 | 5.6 |
Mean | 6.975 | 6.975 | 6.8 | 6.65 | 6.55 | 6.325 | 6.125 | 5.825 |
SD | 0.531507 | 0.531507 | 0.535413 | 0.591608 | 0.58023 | 0.556028 | 0.442531 | 0.359398 |
Table 26: Table 26 shows Glucose level of High-dose Group.
Table 27: comparison of control group, low-dose group and high-dose group
Comparison of Glucose lowering activity of Haritaki | |||||||
Parameter | Day1 | Day3 | Day9 | Day12 | Day15 | Day18 | Day21 |
Control | 6 | 6 | 6 | 6 | 6 | 6 | 6 |
Low Dose | 7 | 7 | 6 | 6 | 6 | 6 | 6 |
High Dose | 6 | 6 | 6 | 6 | 6 | 6 | 5 |
Table 27: Table 27 shows comparison of control group, low-dose group and high-dose group.
Figure 10: Blood Glucose level of control, low and high dose group
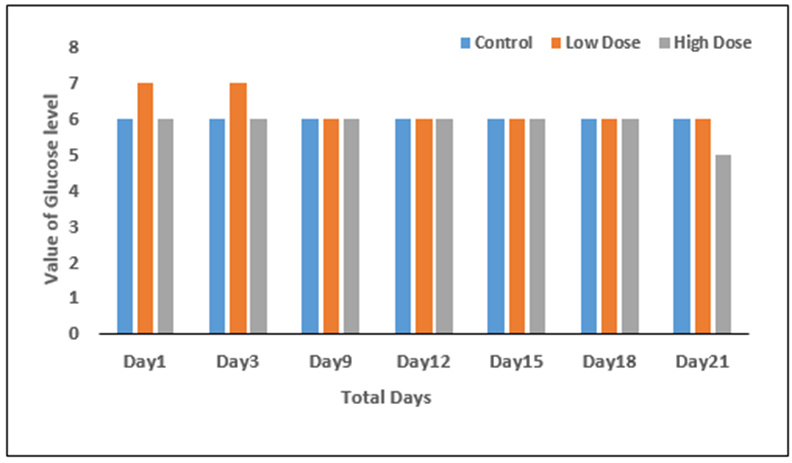
Figure 10: we can infer that haritaki does not have significant glucose lowering activity.
Discussion:
Almost three–quarters of hypertensive persons (639 million) reside in underdeveloped countries with insufficient health resources and people who are unaware of hypertension have poor blood pressure control [22–23]. Hypertension is the single most common noncommunicable illness and one of the main causes of mortality. It is generally established that hypertension and elevated blood levels of low–density lipoprotein (LDL) and triglycerides are related with cardiovascular disease (CVD) [24]. In our study, we assessed the cardioprotective, serum lipid profile, ECG result and the anti–diabetic activity of Phyllanthus emblica and Terminalia chebula.
Antihypertensive effects
The rats were divided into three distinct groups as control group, low dose group and high dose group. The extract of amalaki was given to control group, low dosage group and a high dose group of rats who were on a regular diet. Low dose pre–treatment groups received 100mg of Phyllanthus emblica which is calculated for 1 kg adult and re–estimated for rats to 0.652g/kg body weight and high dose pretreatment groups received 400mg of Phyllanthus emblica which is calculated for 1 kg adult and re estimated for rats to 1.564g/kg body weight. We assessed the systolic blood pressure (SBP), diastolic blood pressure (DBP) and heart rate (HR) of these groups after an interval of 21 days. The low and high dosage groups' heart rates, systolic and diastolic blood pressures did not differ substantially from the control group (p>0.05). A similar result was found when 150 patients with essential hypertension treated with 500 mg dose for 12 weeks with Amlaki [25]. But another two studies found that emblica has BP lowering activity in a dose dependent manner in healthy human subjects [26–27]. In case of Terminalia chebula, the grouping of rats was as same as amlaki but dose was different. Low dose pretreatment groups received 100 mg of Terminalia chebula which was calculated for 1 kg adult and re–estimated for rats to 0.492g/kg body weight and high dose pretreatment groups received 400 mg of terminalia chebula which was calculated for 1 kg adult and re–estimated for rats to 1.180 g/kg body weight. The results were as same as emblica and had no significant effects on blood pressure. But different result was found in another study conferring that emblica has BP lowering activity in a dose dependent manner [28].
Serum Lipid Profile
Amlaki was administered to the predetermined dose to the three distinct groups. Serum total cholesterol, triglyceride, high density lipoprotein-cholesterol and low-density protein-cholesterol were analyzed by using spectrometric assay. Significant decrease in cholesterol and LDL was also found after Amlaki treatment for both high and low dose of the plant (p<0.05) compared to the untreated groups. However, it did not have any notable effects on HDL and triglyceride level when compared with the untreated groups. In case of Haritaki, similar results were found as Amalaki which confer the LDL and cholesterol lowering activity of haritaki and have no significant activity in case of HDL and triglycerides. In agreement with our study, similar results were found in case of LDL and cholesterol while some plants have LDL, cholesterol and triglyceride lowering activity and HDL increasing capacity like Hypericum lysimachioides, Azadirachta indica leaf extract, Rosmarinus officinalis leaves powder, Terminalia Arjuna. [29-32]
Effects on heart rate (ECG)
We assessed the ECG results of control groups, low dose group and high dose groups treated with Amlaki extract to the prementioned dose. This experiment was done in two distinct protocols. In one protocol the heart rate of the rats were measured without digoxin treatment while other protocol measured HR after digoxin treatment. No significant (P>0.05) change was obtained in heart rate after chronic pretreatment with Amalaki in comparison to the untreated group. In addition, there were also no significant changes in heart rate in the RR interval of ECG. We conducted same experiment in case of haritaki and the results were similar to the Amaloki.
Antidiabetic activity
The control group, low–dose and high–dose group of rats were fed normal diet for 21 days and the glucose lowering activity of amlaki was measured by checking blood glucose after every 3–day interval.
When compared to the control group, our results revealed a minor drop in blood glucose following consumption of low and high-dose Amlaki and statistical analysis indicated a non–significant result (p>0.05). As a consequence, we may infer that Amlaki has no significant glucose-lowering effect. In the case of Terminalia Chebula, there was no significant reduction in blood glucose levels in the low and high dosage groups when compared to the untreated group.
Conclusion:
It may be concluded that the findings in our study have proved that the dried powder of Terminalia chebula and Phyllanthus embelica fruits are capable of serving as effective therapeutic agents to treat various ailments. The tests carried out in rat models under varying conditions provided significant evidence that they worked to reverse the disturbed physiological condition and restore it to the regular, healthy and steady state. The dose–dependent gradations observed in the responses has also indicated that the administration of exact dosing of the extract might enhance the therapeutic effect through multiple folds. Further phytochemical analyses on these plants are likely to pave broad pathways on introducing improved alternatives.
References
- Khan, K. H. (2009). Roles of Emblica officinalis in medicine-A review. Bot Res Int, 2(4), 218-228.
View at Publisher | View at Google Scholar - Dhale, D. A., & Mogle, U. P. (2011). Phytochemical screening and antibacterial activity of Phyllanthus emblica (L.). Science Research Reporter, 1(3), 138-142.
View at Publisher | View at Google Scholar - Mirunalini, S. & Krishnaveni,, M. (2010). Therapeutic potential of Phyllanthus emblica (amla): the ayurvedic wonder. Journal of Basic and Clinical Physiology and Pharmacology, 21(1), 93-105.
View at Publisher | View at Google Scholar - Ahmad, B., Hafeez, N., Rauf, A., Bashir, S., Linfang, H., Rehman, M. U., ... & Rengasamy, K. R. (2021). Phyllanthus emblica: A comprehensive review of its therapeutic benefits. South African Journal of Botany, 138, 278-310.
View at Publisher | View at Google Scholar - Bhandari, P. R., & Kamdod, M. A. (2012). Emblica officinalis (Amla): A review of potential therapeutic applications. International Journal of Green Pharmacy (Medknow Publications & Media Pvt. Ltd.), 6(4).
View at Publisher | View at Google Scholar - Muhammad, S., Khan, B. A., Akhtar, N., Mahmood, T., Rasul, A., Hussain, I., ... & Badshah, A. (2012). The morphology, extractions, chemical constituents and uses of Terminalia chebula: A review. Journal of Medicinal Plants Research, 6(33), 4772-4775.
View at Publisher | View at Google Scholar - Nigam, M., Mishra, A. P., Adhikari‐Devkota, A., Dirar, A. I., Hassan, M. M., Adhikari, A., ... & Devkota, H. P. (2020). Fruits of Terminalia chebula Retz.: A review on traditional uses, bioactive chemical constituents and pharmacological activities. Phytotherapy Research, 34(10), 2518-2533.
View at Publisher | View at Google Scholar - Kannan, P., Ramadevi, S. R., & Hopper, W. (2009). Antibacterial activity of Terminalia chebula fruit extract. African Journal of Microbiology Research, 3(4), 180-184.
View at Publisher | View at Google Scholar - Rekha, V., Jayamathi, R., Vijayalakshmi, D., Prabu, N. K., & Sunayana Manipal, K. (2014). Anticariogenic effect of Terminalia chebula. Journal of clinical and diagnostic research: JCDR, 8(8), ZC51.
View at Publisher | View at Google Scholar - Kumar, G. P. S., Arulselvan, P., Kumar, D. S., & Subramanian, S. P. (2006). Anti-diabetic activity of fruits of Terminalia chebula on streptozotocin induced diabetic rats. Journal of health science, 52(3), 283-291.
View at Publisher | View at Google Scholar - Raju, D., Ilango, K., Chitra, V., & Ashish, K. (2009). Evaluation of Anti-ulcer activity of methanolic extract of Terminalia chebula fruits in experimental rats. Journal of Pharmaceutical Sciences and research, 1(3), 101.
View at Publisher | View at Google Scholar - Bag, A., Kumar Bhattacharyya, S., Kumar Pal, N., & Ranjan Chattopadhyay, R. (2013). Anti-inflammatory, anti-lipid peroxidative, antioxidant and membrane stabilizing activities of hydroalcoholic extract of Terminalia chebula fruits. Pharmaceutical Biology, 51(12), 1515-1520.
View at Publisher | View at Google Scholar - Kearney PM, Whelton M, Reynolds K, Muntner P, Whelton PK, He J. Global burden of hypertension: analysis of worldwide data.Lancet. 2005; 365:217–223. doi: 10.1016/S0140-6736(05)17741-1
View at Publisher | View at Google Scholar - Bondre, S. V., Chavan, R. S., Raut, I. D., Mohite, S. K., & Magdum, C. S. (2020). An overview of survey on antihypertensive drugs. ACE, 27, 3.
View at Publisher | View at Google Scholar - Kavanagh, R. (2020). Antihypertensive drugs. In Side Effects of Drugs Annual (Vol. 42, pp. 215-226). Elsevier.
View at Publisher | View at Google Scholar - Sanidas, E., Velliou, M., Papadopoulos, D., Fotsali, A., Iliopoulos, D., Mantzourani, M., ... & Barbetseas, J. (2020). Antihypertensive Drugs and Risk of Cancer: Between Scylla and Charybdis. American Journal of Hypertension, 33(12), 1049-1058.
View at Publisher | View at Google Scholar - Shendye, N. V., & Gurav, S. S. (2014). Cynodon dactylon: A systemic review of pharmacognosy, phytochemistry and pharmacology. Int J Pharm Sci, 6(8), 7-12
View at Publisher | View at Google Scholar - Ahringer, J. (2006). Reverse genetics. In WormBook: The Online Review of C. elegans Biology [Internet]. WormBook.
View at Publisher | View at Google Scholar - A Bag, SK Bhattacharyya, RR Chattopadhyay; (Mar, 2013), The development of Terminalia chebula Retz. (Combretaceae) in clinical research. Asian Pacific Journal of tropical biomedicine; 3(3):244-52.
View at Publisher | View at Google Scholar - Lee, H. S.; Jung, S. H.; Yun, B. S.; Lee, K. W, (2007);
View at Publisher | View at Google Scholar - D Alan, R Debra, H Lu, B Anuj; (May, 2009); Measuring Blood Pressure using Tail Cuff method; J Vis Exp; (27):1291.
View at Publisher | View at Google Scholar - WHO. The world health report 2002: reducing risks, promoting healthy life. Geneva: World Health Organization, 2002.
View at Publisher | View at Google Scholar - WHO. WHO Global Report. Preventing chronic disease: a vital investment. Geneva: World Health Organization, 2005
View at Publisher | View at Google Scholar - Pooja, S., Manish, B., Pradeep, K., Sunita, T., & Kalpana, S. (2018). ANTIHYPERTENSIVE AND LIPID LOWERING EFFECT OF TERMINALIA ARJUNA (AQUEOUS EXTRACT) IN SPONTANEOUSLY HYPERTENSIVE RATS (SHR): AN EXPERIMENTAL STUDY.
View at Publisher | View at Google Scholar - Shanmugarajan, D., Girish, C., Harivenkatesh, N., Chanaveerappa, B., & Prasanna Lakshmi, N. C. (2021). Antihypertensive and pleiotropic effects of Phyllanthus emblica extract as an add‐on therapy in patients with essential hypertension—A randomized double‐blind placebo‐controlled trial. Phytotherapy Research.
View at Publisher | View at Google Scholar - Fatima, N., Pingali, U., & Pilli, R. (2014). Evaluation of Phyllanthus emblica extract on cold pressor induced cardiovascular changes in healthy human subjects. Pharmacognosy research, 6(1), 29.
View at Publisher | View at Google Scholar - Ghaffari, S., Navabzadeh, M., Ziaee, M., Ghobadi, A., Ghods, R., & Hashem-Dabaghian, F. (2020). A Randomized, Triple-Blind, Placebo-Controlled, Add-On Clinical Trial to Evaluate the Efficacy of Emblica officinalis in Uncontrolled Hypertension. Evidence-Based Complementary and Alternative Medicine, 2020.
View at Publisher | View at Google Scholar - Khan, A. U., & Gilani, A. H. (2008). Pharmacodynamic evaluation of Terminalia bellerica for its antihypertensive effect. Journal of food and drug analysis, 16(3).
View at Publisher | View at Google Scholar - Hakimoğlu, F., Kızıl, G., Kanay, Z., Kızıl, M., & Isı, H. (2007). The effect of ethanol extract of Hypericum lysimachioides on lipid profile in hypercholesterolemic rabbits and its in vitro antioxidant activity. Atherosclerosis, 192(1), 113-122.
View at Publisher | View at Google Scholar - Chattopadhyay, R. R., & Bandyopadhyay, M. (2005). Effect of Azadirachta indica leaf extract on serum lipid profile changes in normal and streptozotocin induced diabetic rats. African Journal of Biomedical Research, 8(2), 101-104.
View at Publisher | View at Google Scholar - Labban, L., Mustafa, U. E. S., & Ibrahim, Y. M. (2014). The effects of rosemary (Rosmarinus officinalis) leaves powder on glucose level, lipid profile and lipid perodoxation. International Journal of Clinical Medicine, 2014.
View at Publisher | View at Google Scholar - Priya, N., Mathur, K. C., Sharma, A., Agrawal, R. P., Agarwal, V., & Acharya, J. (2019). Effect of Terminalia Arjuna on total platelet count and lipid profile in patients of coronary artery disease. Advances in Human Biology, 9(1), 98.
View at Publisher | View at Google Scholar
